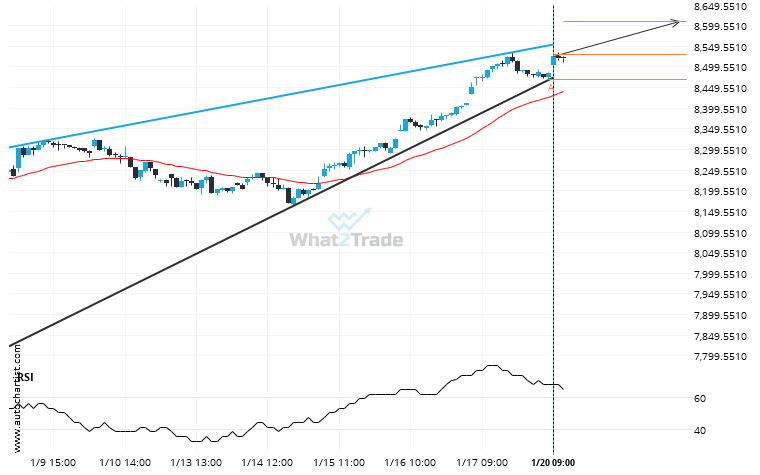
Emerging Rising Wedge pattern in its final wave was identified on the FTSE 100 1 hour chart. After a strong bullish run, we find FTSE 100 heading towards the upper triangle line with a possible resistance at 8610.1248. If the resistance shows to hold, the Rising Wedge pattern suggests a rebound back towards current levels.
Related Posts
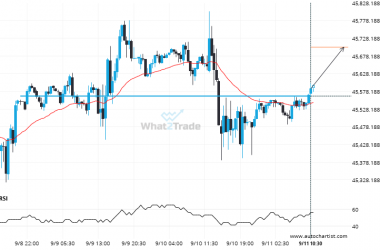
Big movement possible on DOW 30 after a breach of 45564.9883
The price of DOW 30 in heading in the direction of 45702.3633. Despite the recent breakout through 45564.9883…
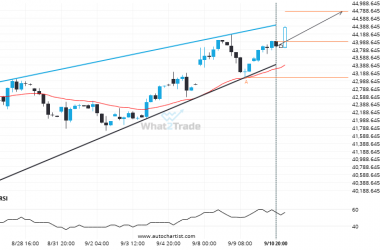
Nikkei 225 is signaling a possible trend reversal on the intraday charts with price not breaching support.
Nikkei 225 was identified at around 43994.0 having recently rebounded of the support on the 4 hour data…
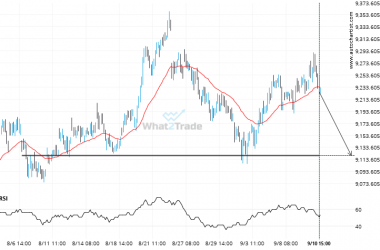
FTSE 100 is quickly approaching a very important level it has previously tested numerous times in the past
FTSE 100 is approaching a support line at 9120.0000. If it hits the support line, it may break…

