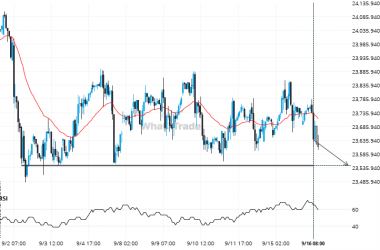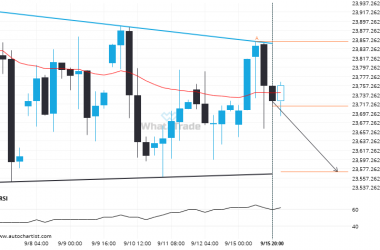
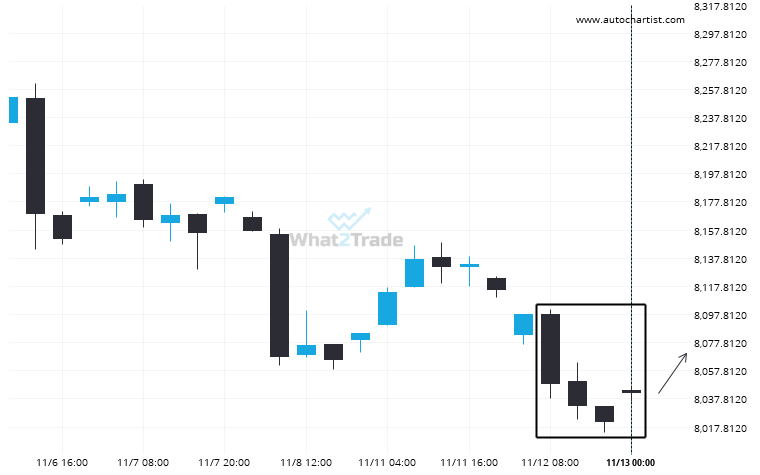
Due to the rate of consecutive bearish candles on FTSE 100 4 hour chart we could be in for a price correction. If not, this trend could be a sign of things to come
FTSE 100 consistently settling in one direction. Will it continue?

Due to the rate of consecutive bearish candles on FTSE 100 4 hour chart we could be in for a price correction. If not, this trend could be a sign of things to come