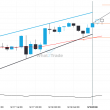
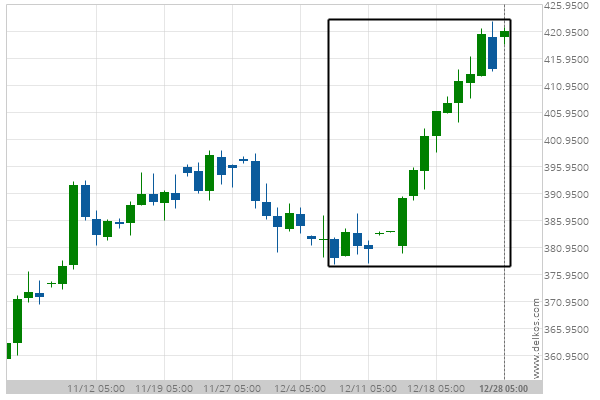
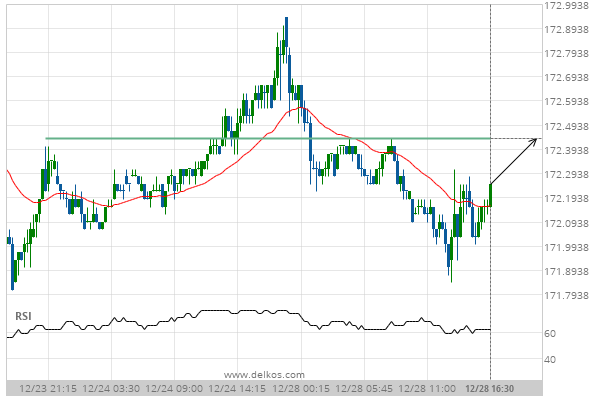
Exxon Mobil Corp. has broken through the resistance line of a Triangle technical chart pattern. Because we have seen it retrace from this position in the past, one should wait for confirmation of the breakout before trading. It has touched this line twice in the last 10 days and suggests a target line to be around 42.86 within the next 16 hours.
Related Posts
A possible move on XOM as it heads towards resistance
XOM is heading towards the resistance line of a Rising Wedge and could reach this point within the…
AMD keeps moving closer towards 162.2200. Will it finally breach this level?
AMD is en route to a very important line that will be a definite deciding factor of what…
NKE – approaching a support line that has been previously tested at least twice in the past
Emerging Falling Wedge detected on NKE – the pattern is an emerging one and has not yet broken…

