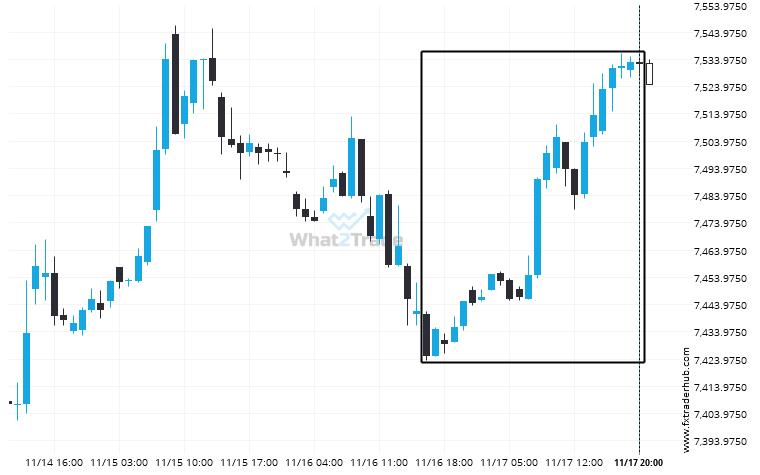
An unexpected large move has occurred on UK100 1 hour chart beginning at 7425.0 and ending at 7532.0. Is this a sign of something new? What can we expect in the future?
Related Posts
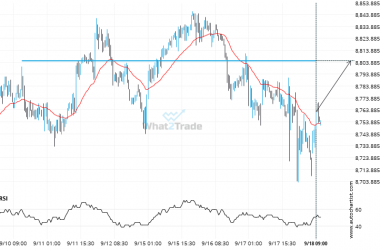
If you’re short ASX 200 you should be aware of the rapidly approaching level of 8805.2998
ASX 200 is heading towards a line of 8805.2998. If this movement continues, the price of ASX 200…
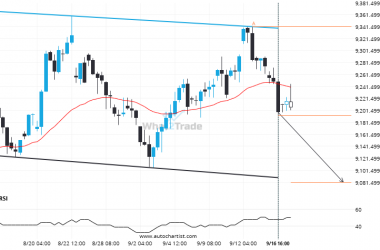
FTSE 100 is quickly approaching the support line of a Channel Down. We expect either a breakout through this line or a rebound.
Emerging Channel Down pattern in its final wave was identified on the FTSE 100 4 hour chart. After…
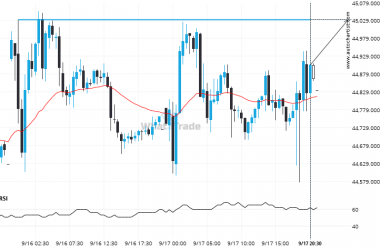
Supports and resistances are primary concepts of technical analysis. Nikkei 225 is heading for an important price of 45031.0000 – read about what this could mean for the future.
Nikkei 225 is moving towards a line of 45031.0000 which it has tested numerous times in the past.…

