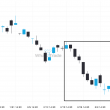
NAS 100 has moved lower by 9.76% from 22178.648 to 20013.9543 in the last 21 days.
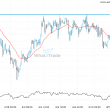
Extreme movement experienced on NAS 100. Check this chart to see what to do next
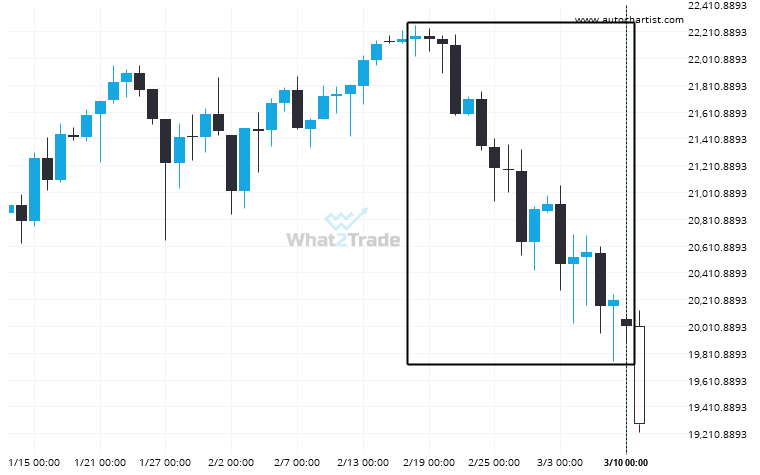

NAS 100 has moved lower by 9.76% from 22178.648 to 20013.9543 in the last 21 days.