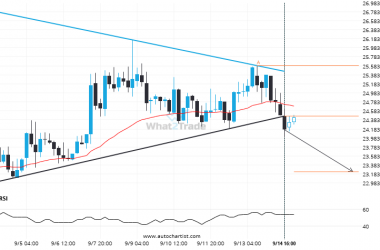
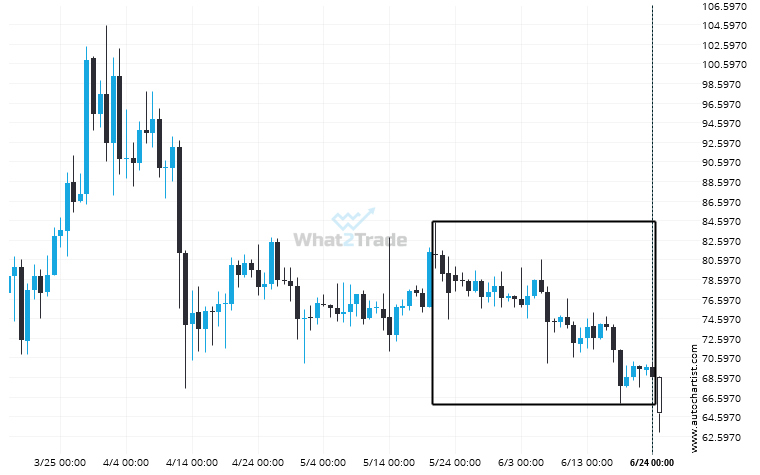
An unexpected large move has occurred on LTCEUR Daily chart beginning at 81.04 and ending at 68.6. Is this a sign of something new? What can we expect in the future?
Extreme movement experienced on LTCEUR. Check this chart to see what to do next

An unexpected large move has occurred on LTCEUR Daily chart beginning at 81.04 and ending at 68.6. Is this a sign of something new? What can we expect in the future?