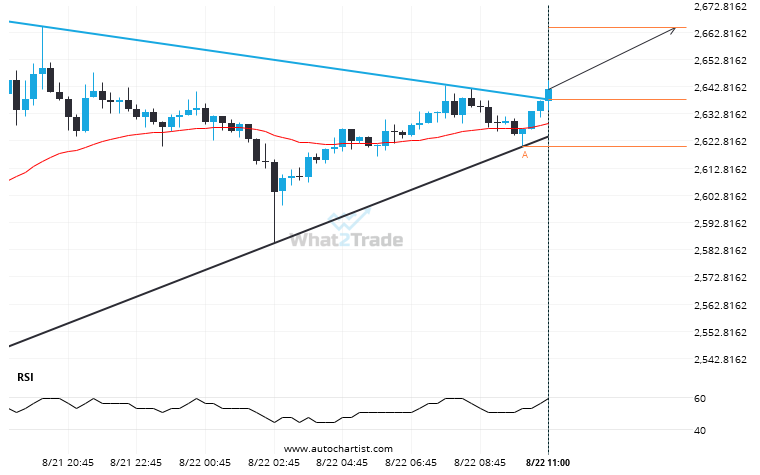
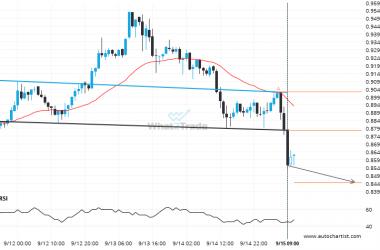
ETHUSD moved through the resistance line of a Triangle at 2637.978 on the 15 Minutes chart. This line has been tested a number of times in the past and this breakout could mean an upcoming change from the current trend. It may continue in its current direction toward 2664.7100.
Related Posts
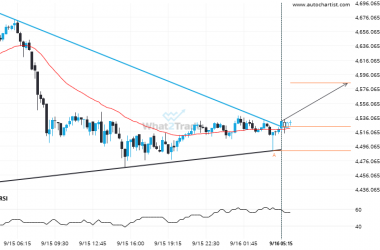
ETHUSD has broken out from the Triangle pattern. Expect it to hit 4584.1456 soon.
The breakout of ETHUSD through the resistance line of a Triangle could be a sign of the road…
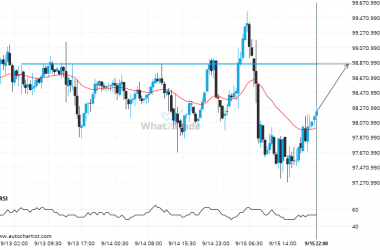
If BTCEUR touches 98853.5625 it may be time to take action.
The movement of BTCEUR towards 98853.5625 price line is yet another test of the line it reached numerous…
After testing support twice in the past, ADAUSD has finally broken through. Can we expect a bearish trend to follow?
You would be well advised to confirm the breakout that has just occurred – do you believe the…

