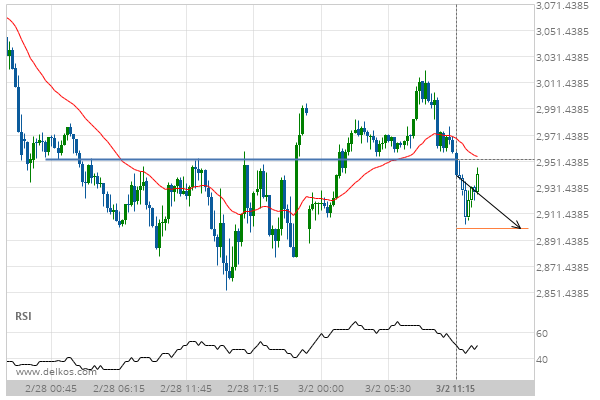
E-mini S&P 500 MARCH 2020 has broken through the support line of a Support. It has touched this line numerous times in the last 4 days. This breakout shows a potential move to 2900.4751 within the next 6 hours. Because we have seen it retrace from this position in the past, one should wait for confirmation of the breakout before trading.
E-mini S&P 500 MARCH 2020 has broken through the support line of a Support. It has touched this line numerous times in the last 4 days.