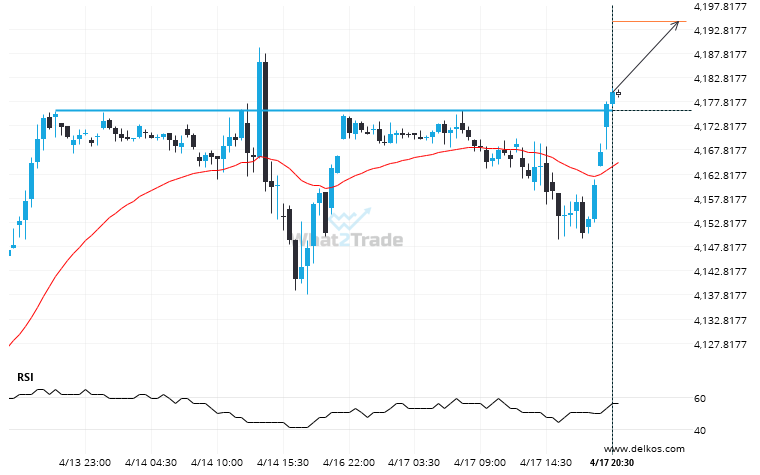
E-mini S&P 500 JUNE 2023 has broken through a resistance line. It has touched this line numerous times in the last 5 days. This breakout shows a potential move to 4194.4502 within the next 11 hours. Because we have seen it retrace from this level in the past, one should wait for confirmation of the breakout.
Related Posts
Brent Crude formed a Triangle on the 15 Minutes chart. Retest of support in sight.
Emerging Triangle detected on Brent Crude – the pattern is an emerging one and has not yet broken…
If US Oil touches 64.6650 it may be time to take action.
US Oil is moving towards a resistance line. Because we have seen it retrace from this level in…
Supports and resistances are primary concepts of technical analysis. Natural Gas is heading for an important price of 2.7230 – read about what this could mean for the future.
Natural Gas is moving towards a key support level at 2.7230. This is a previously tested level for…