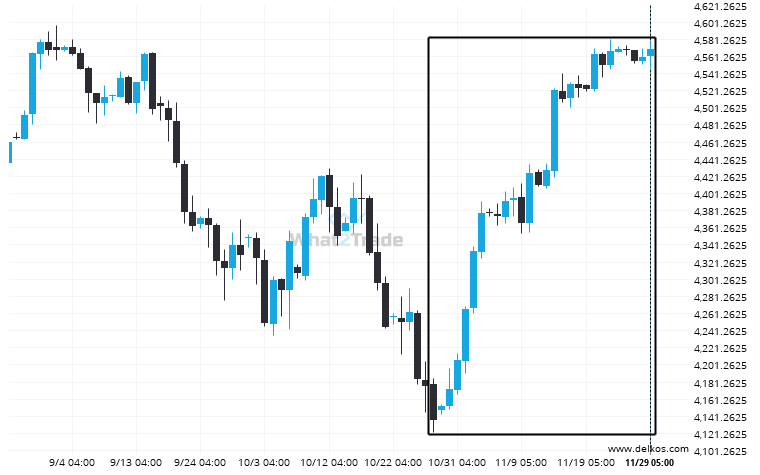
An unexpected large move has occurred on E-mini S&P 500 DECEMBER 2023 Daily chart beginning at 4136.5 and ending at 4569.75. Is this a sign of something new? What can we expect in the future?
Related Posts
Brent Crude is signaling a possible trend reversal on the intraday charts with price not breaching resistance.
Emerging Channel Up pattern in its final wave was identified on the Brent Crude 1 hour chart. After…
If you’re short Natural Gas you should be aware of the rapidly approaching level of 3.4655
Natural Gas is en route to a very important line that will be a definite deciding factor of…
After testing the support line numerous times, Gold Spot is once again approaching this line. Can we expect a bearish trend to follow?
Gold Spot is heading towards the support line of a Channel Down. If this movement continues, the price…