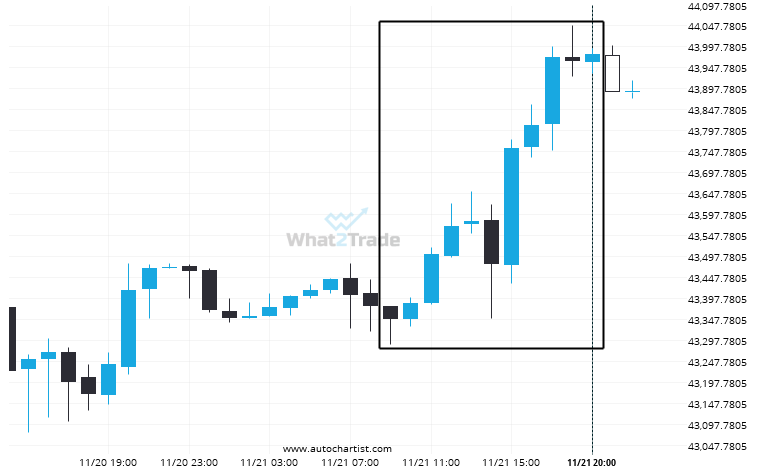
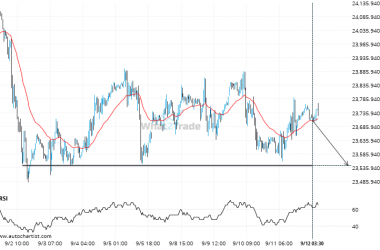
An unexpected large move has occurred on DOW 30 1 hour chart beginning at 43346.73 and ending at 43980.36. Is this a sign of something new? What can we expect in the future?
Related Posts
Nikkei 225 – breach of a trending support line that has been tested at least twice before.
The last 8 30 Minutes candles on Nikkei 225 formed a Triangle pattern and broken out through the…
Will FTSE 100 break through the support level it tested before?
The price of FTSE 100 in heading back to the support area. It is possible that it will…
DOW 30 – approaching a resistance line that has been previously tested at least twice in the past
DOW 30 is heading towards the resistance line of a Rising Wedge and could reach this point within…