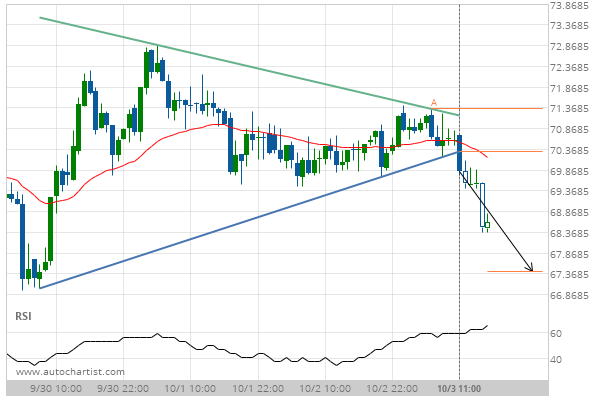
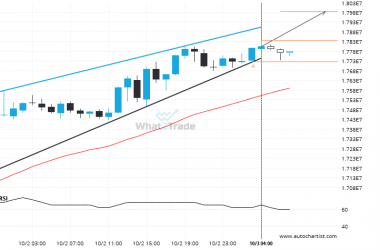
DASHUSD has broken through the support line of a Triangle. It has touched this line at least twice in the last 4 days. This breakout indicates a potential move to 67.4344 within the next 19 hours. Because we have seen it retrace from this positions in the past, one should wait for confirmation of the breakout before trading.
Related Posts
DASHEUR breakout from a Rising Wedge trade setup. Will it continue this trend to hit the target price?
DASHEUR has broken through the support line of a Rising Wedge technical chart pattern. Because we have seen…
Supports and resistances are primary concepts of technical analysis. XRPUSD is heading for an important price of 3.3130 – read about what this could mean for the future.
XRPUSD is heading towards a line of 3.3130. If this movement continues, the price of XRPUSD could test…
ETHJPY is approaching a resistance line of a Channel Up. It has touched this line numerous times in the last 10 days.
ETHJPY is heading towards the resistance line of a Channel Up. If this movement continues, the price of…