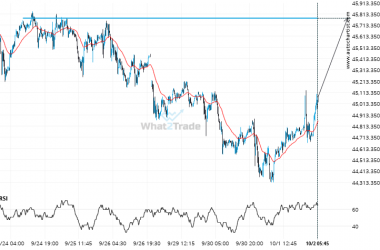
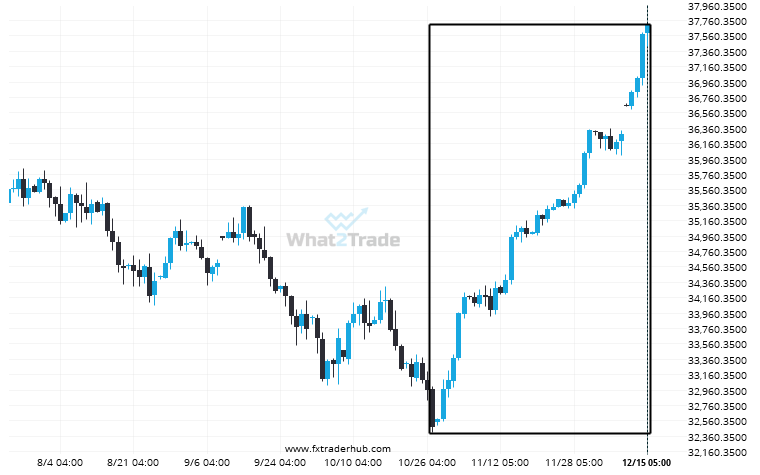
US30 has experienced an exceptionally large movement higher by 16.06% from 32475.0 to 37690.0 in the last 50 days.
Related Posts
Nikkei 225 through 37689.35294117647. Is this a confirming a breakout? Will it continue its path in the current trend toward 38106.6602?
Nikkei 225 has broken through a resistance line of a Triangle chart pattern. If this breakout holds true,…
Supports and resistances are primary concepts of technical analysis. Nikkei 225 is heading for an important price of 37699.0000 – read about what this could mean for the future.
Nikkei 225 is moving towards a key resistance level at 37699.0000. This is a previously tested level for…
An unexpected large move has occurred on FTSE 100 Daily chart! Is this a sign of something new? What can we expect?
For those of you that don’t believe in trends, this may be an opportunity to take advantage of…