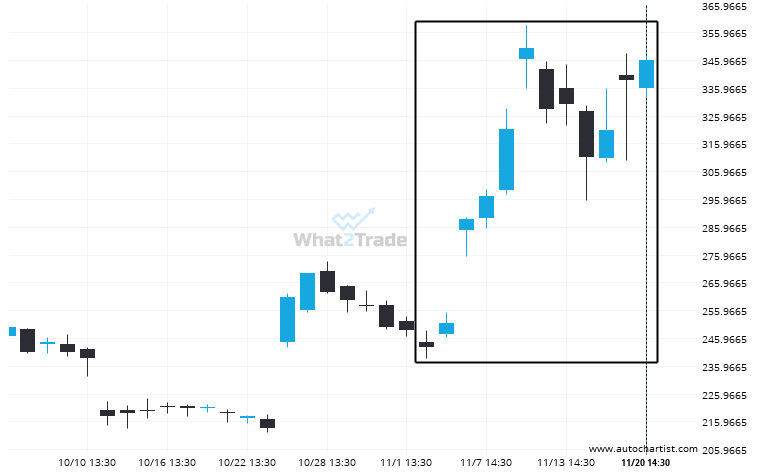
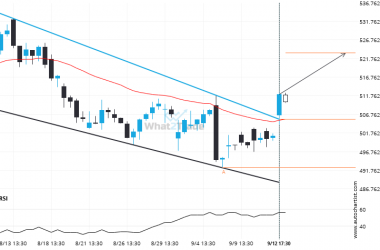
TSLA hits 345.88 after a 42.4% move spanning 17 days.
Related Posts
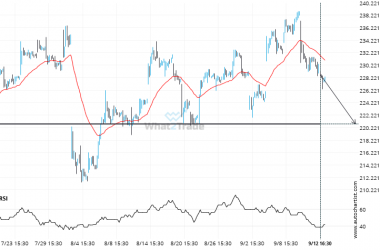
AMZN seems to be on its way to support – a possible opportunity?
AMZN is moving towards a support line. Because we have seen it retrace from this level in the…
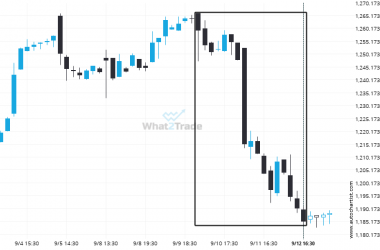
NFLX reached 1185.06 after a 5.9% move spanning 3 days.
NFLX has moved lower by 5.9% from 1259.325 to 1185.06 in the last 3 days.
Resistance line breached by MSFT. This price has been tested at least twice before.
MSFT has broken through a resistance line of a Channel Down chart pattern. If this breakout holds true,…

