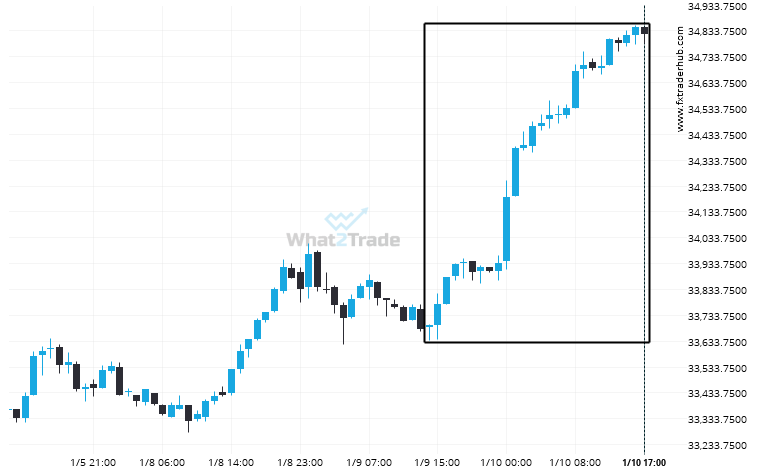
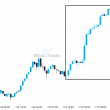
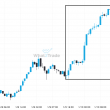
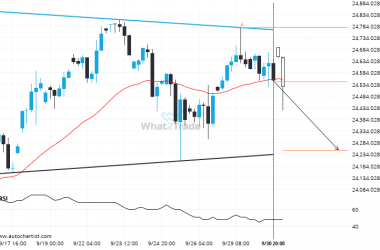
An unexpected large move has occurred on JPN225 1 hour chart beginning at 33695.0 and ending at 34820.0. Is this a sign of something new? What can we expect in the future?
Related Posts
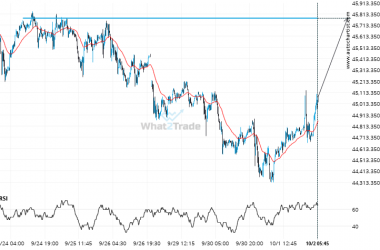
Nikkei 225 heading towards a price it has tested 5 times in the recent past.
A strong resistance level has been identified at 45777.0000 on the 15 Minutes Nikkei 225 chart. Nikkei 225…
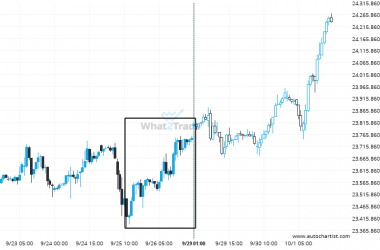
Big bullish swing on DAX 40 – this may be one of its more notable movements in the recent session.
A movement of 1.66% over 4 days on DAX 40 doesn’t go unnoticed. You may start considering where…
A possible move on NAS 100 as it heads towards support
NAS 100 is approaching the support line of a Triangle. It has touched this line numerous times in…

