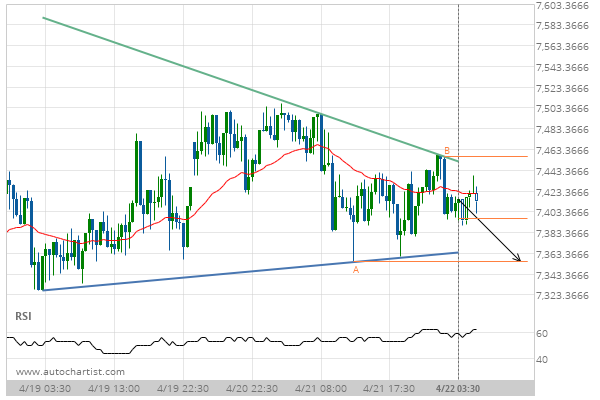
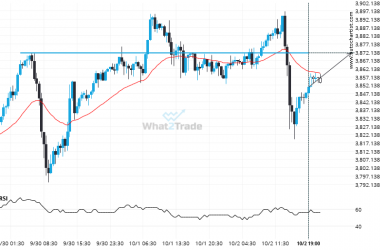
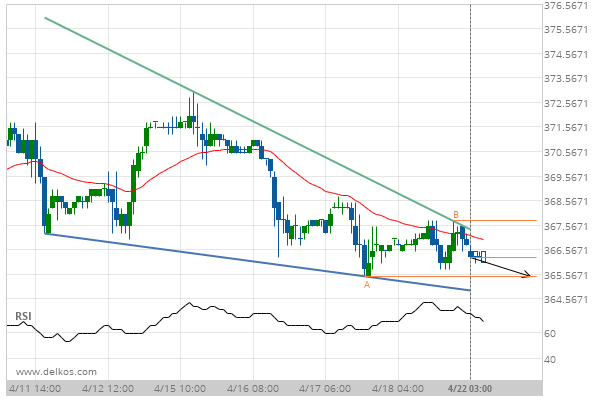
LTCEUR formed a Falling Wedge on the 1 hour chart. Retest of support in sight. CryptoParWhat2tradeAugust 19, 2025 6:15 am1 minute read
Rare bullish streak on the ASX 200 Daily chart. Indices mondiauxParWhat2tradeAugust 19, 2025 6:14 am1 minute read
A Triangle has formed, US Oil is approaching resistance. Can we expect a breakout and the start of a new trend or a reversal? FuturesParWhat2tradeAugust 19, 2025 6:14 am1 minute read
1 min Futures A Triangle has formed, US Oil is approaching resistance. Can we expect a breakout and the start of a new trend or a reversal? US Oil is heading towards the support line of a Triangle. If this movement continues, the price of… What2tradeAugust 19, 2025 6:14 am Lire la suite
1 min Futures US Oil has broken through a resistance line. It has touched this line numerous times in the last 6 days. US Oil has breached the resistance line at 63.3495. It may continue the bullish trend towards 64.1665, or,… What2tradeAugust 18, 2025 10:15 pm Lire la suite
1 min Futures Natural Gas formed a Falling Wedge on the 4 hour chart. Retest of support in sight. An emerging Falling Wedge has been detected on Natural Gas on the 4 hour chart. There is a… What2tradeAugust 18, 2025 11:18 am Lire la suite