
Browsing Category
Actions US
6609 messages
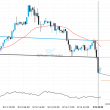
Because META formed a Channel Down pattern, we expect it to touch the support line. If it breaks through support it may move much lower
META is moving towards a support line which it has tested numerous times in the past. We have…
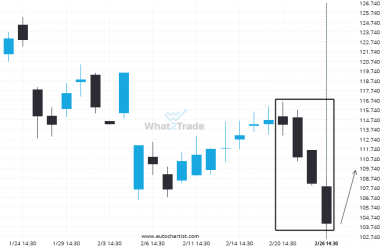
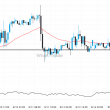
Rare set of bearish consecutive candles on the AMD Daily chart. Can we expect a turn-around?
Trend followers are probably eagerly watching AMD to see if its latest 4 consecutive candles continues. If not,…
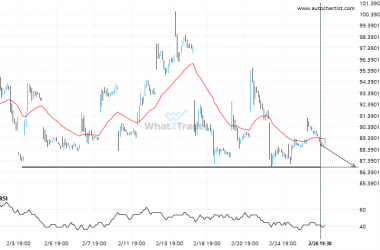
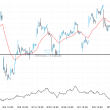
Important price line being approached by BIDU. This price has been tested numerous times before.
BIDU is heading towards 86.8100 and could reach this point within the next 2 days. It has tested…
Extreme movement experienced on GOOGL. Check this chart to see what to do next
Those of you that are trend followers are probably eagerly watching GOOGL to see if its latest 13.06%…
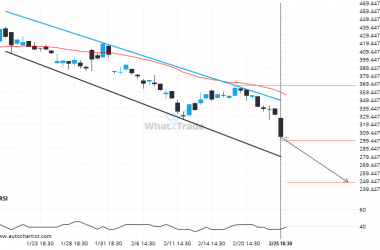
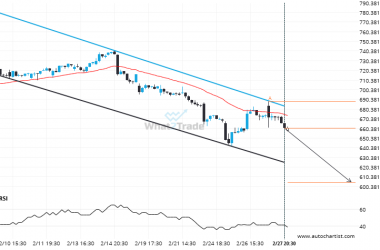
TSLA is signaling a possible trend reversal on the intraday charts with price not breaching resistance.
A Channel Down pattern was identified on TSLA at 298.79, creating an expectation that it may move to…
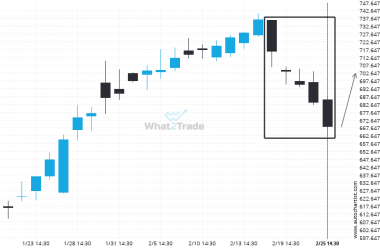
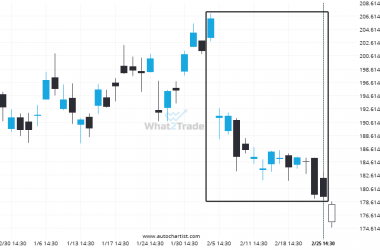
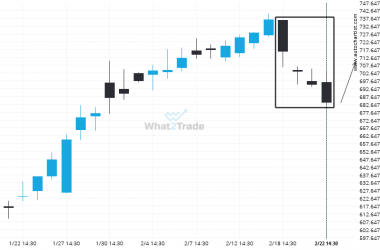
META moves lower to 668.1600 in the last 8 days.
After posting 5 consecutive bearish candles in 8 days, you may start considering where META is heading next,…
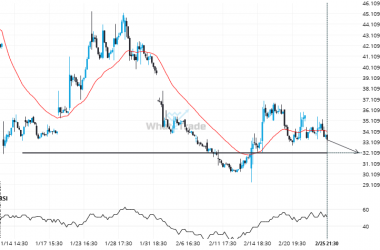
MRNA is approaching 32.0600. We expect either a breakout through this line, or a rebound.
MRNA is en route to a very important line that will be a definite deciding factor of what…
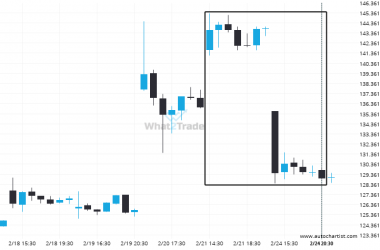
BABA hits 128.95 after a 10.21% move spanning 4 days
BABA hits 128.95 after a 10.21% move spanning 4 days.
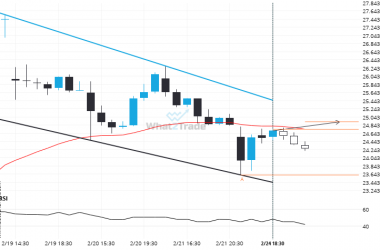
INTC is quickly approaching the resistance line of a Flag. We expect either a breakout through this line or a rebound.
INTC is approaching the resistance line of a Flag. It has touched this line numerous times in the…
META consistently settling in one direction. Will it continue?
Trend followers are probably eagerly watching META to see if its latest 4 consecutive candles continues. If not,…