


Browsing Category
Actions US
6606 messages
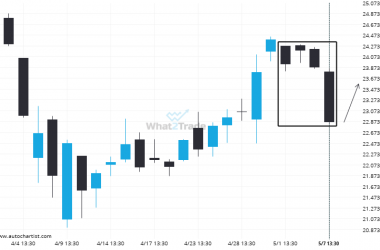
PFE has formed 4 bearish candles successively, what is the probability of getting another bearish candle?
Due to the rate of consecutive bearish candles on PFE Daily chart we could be in for a…
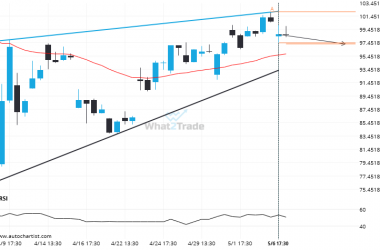
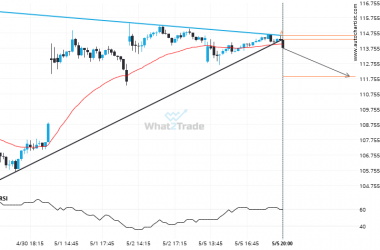
AMD is approaching a support line of a Rising Wedge. It has touched this line numerous times in the last 42 days.
AMD is heading towards the support line of a Rising Wedge. If this movement continues, the price of…
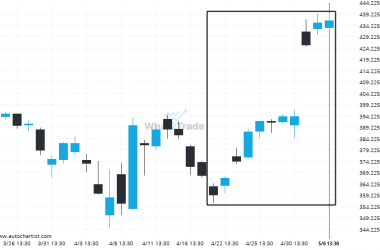
MSFT moves higher to 436.29 in the last 16 days.
MSFT hits 436.29 after a 21.51% move spanning 16 days.
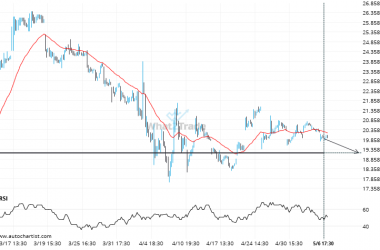
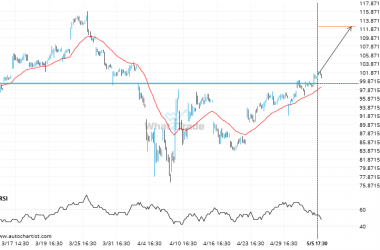
INTC heading towards a price it has tested 6 times in the recent past.
The movement of INTC towards 19.1600 price line is yet another test of the line it reached numerous…
NVDA breakout from a Triangle trade setup. Will it continue this trend to hit the target price?
Triangle pattern identified on NVDA has broken through a support level with the price momentum continuing to move…
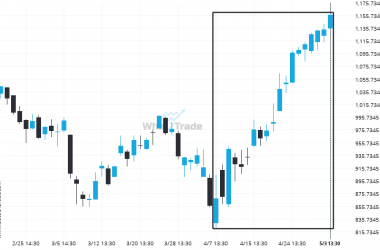
NFLX moves higher to 1156.14 in the last 27 days.
For those of you that don’t believe in trends, this may be an opportunity to take advantage of…
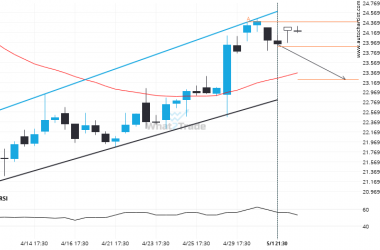
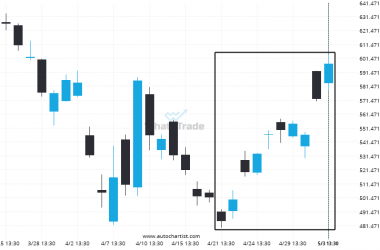
If you’re short AMD you should be aware that 99.3300 has just been breached – a level tested 5 time in the past
A strong resistance level has been breached at 99.3300 on the 1 hour AMD chart. Technical Analysis theory…
PFE – approaching a support line that has been previously tested at least twice in the past
An emerging Flag has been detected on PFE on the 4 hour chart. There is a possible move…
Is the extremely large movement on META a sign of things to come?
META experienced an extremely large move that lasted 13. This movement is in the 95.0 percentile and is…
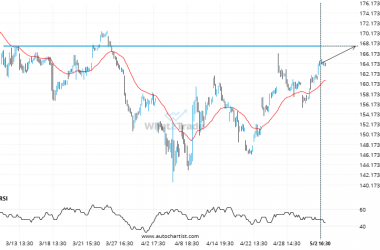
If you’re short GOOGL you should be aware of the rapidly approaching level of 167.6300
GOOGL is moving towards a key resistance level at 167.6300. This is a previously tested level for GOOGL.…