


Browsing Category
Actions US
6606 messages
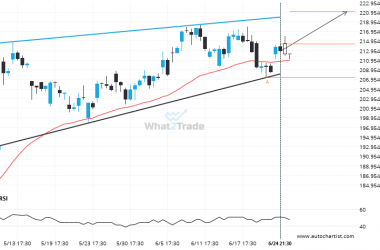
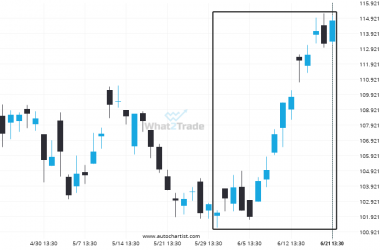
Important resistance line being approached by AMZN. This price has been tested numerous time in the last 65 days
An emerging Rising Wedge has been detected on AMZN on the 4 hour chart. There is a possible…
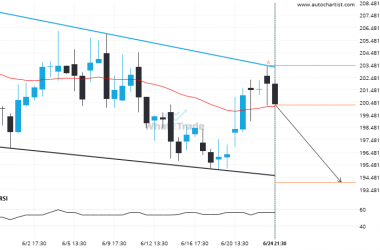
Supports and resistances are primary concepts of technical analysis. XOM is heading for an important price of 101.7200 – read about what this could mean for the future.
XOM is about to retest a key horizontal support level near 101.7200. It has tested this level 5…
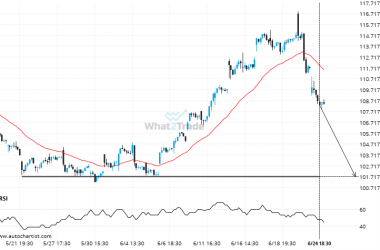
Because AAPL formed a Channel Down pattern, we expect it to touch the support line. If it breaks through support it may move much lower
AAPL is moving towards a support line. Because we have seen it retrace from this line before, we…
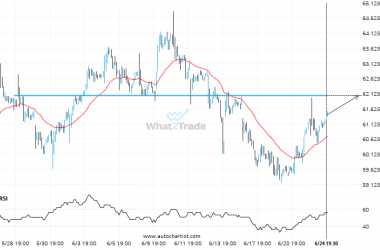
NKE seems to be on its way to resistance – a possible opportunity?
A strong resistance level has been identified at 62.0500 on the 30 Minutes NKE chart. NKE is likely…
Extreme movement experienced on XOM. Check this chart to see what to do next
XOM experienced an extremely large move that lasted 23. This movement is in the 98.0 percentile and is…
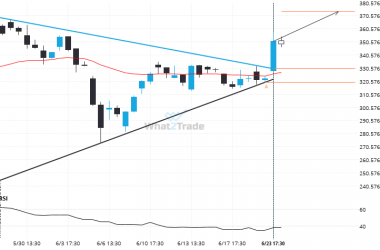
Bulls aim for 374.0358 after the TSLA triggered a bullish formation on the 4 hour chart
You would be well advised to confirm the breakout that has just occurred – do you believe the…
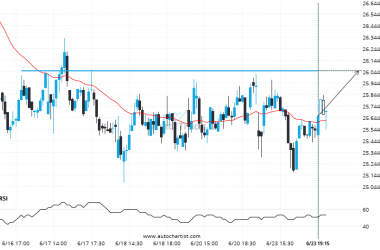
MRNA is quickly approaching a very important level it has previously tested numerous times in the past
MRNA is moving towards a key resistance level at 26.0500. This is a previously tested level for MRNA.…
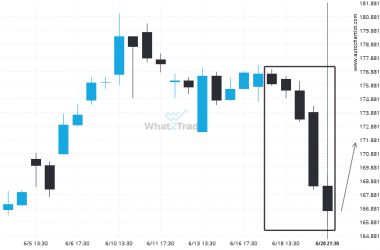
Is the GOOGL poised for a turn-around after 5 consecutive bearish 4 hour candles?
GOOGL has experienced an unusual quantity of bearish candles on the 4 hour timeframe. This is in the…
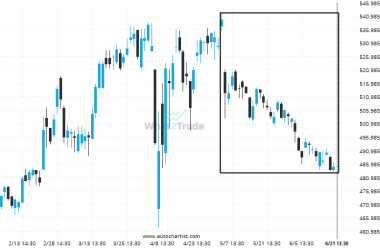
BRK.B moves lower to 484.915 in the last 51 days.
BRK.B has moved lower by 10.13% from 539.56 to 484.915 in the last 51 days.
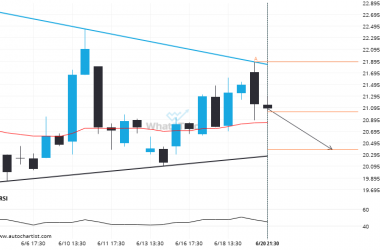
Because INTC formed a Triangle pattern, we expect it to touch the support line. If it breaks through support it may move much lower
A Triangle pattern was identified on INTC at 21.03, creating an expectation that it may move to the…