
Browsing Category
Uncategorized
616 messages
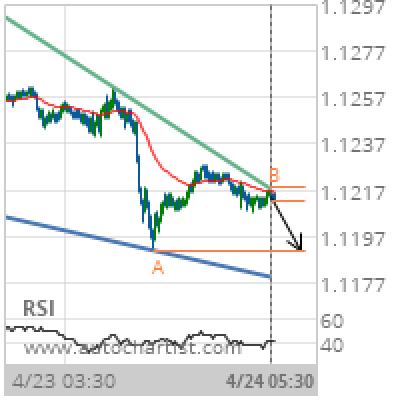
EUR/USD Target Level: 1.1191
Falling Wedge identified at 24-Apr-2019 05:30 UTC. This pattern is still in the process of forming. Possible bearish price movement towards the support 1.1191 within the next 19 hours. Supported by Downward sloping Moving Average Chart 15 MinutesPattern Falling WedgeLength 226 CandlesIdentified 24-Apr-2019 05:30 UTC
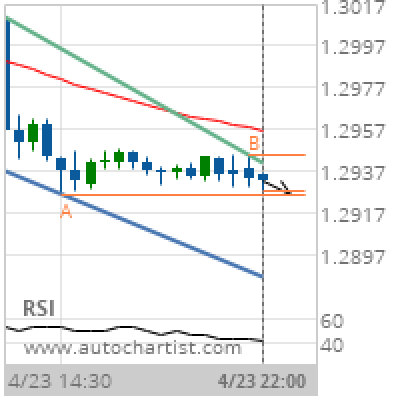
GBP/USD Target Level: 1.2926
Channel Down identified at 23-Apr-2019 22:00 UTC. This pattern is still in the process of forming. Possible bearish price movement towards the support 1.2926 within the next 5 hours. Supported by Downward sloping Moving Average Chart 30 MinutesPattern Channel DownLength 31 CandlesIdentified 23-Apr-2019 22:00 UTC
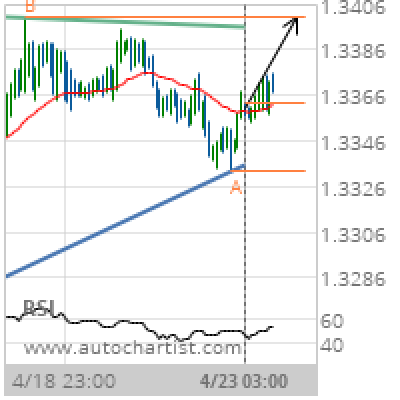
USD/CAD Target Level: 1.3400
Ascending Triangle identified at 23-Apr-2019 03:00 UTC. This pattern is still in the process of forming. Possible bullish price movement towards the resistance 1.3400 within the next day. Supported by Upward sloping Moving Average Chart 1 hourPattern Ascending TriangleLength 115 CandlesIdentified 23-Apr-2019 03:00 UTC
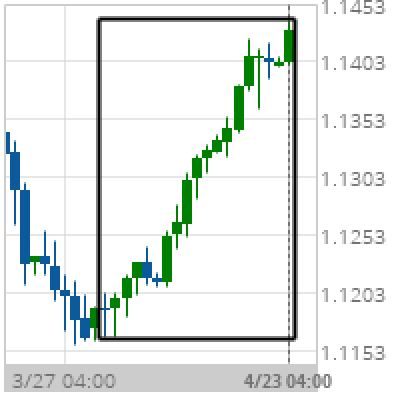
Big Movement EUR/CHF
EUR/CHF experienced a 2.15% bullish movement in the last 22 days. Chart DailyPattern Big MovementLength 19 CandlesIdentified 23-Apr-2019 04:00 UTC
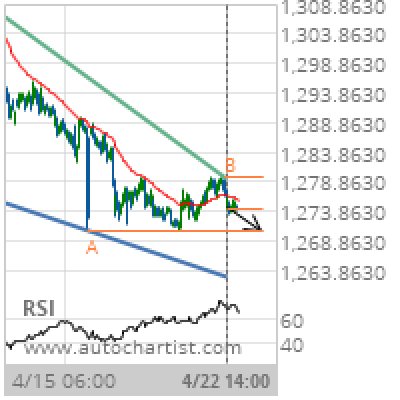
XAU/USD Target Level: 1270.7000
Falling Wedge identified at 22-Apr-2019 14:00 UTC. This pattern is still in the process of forming. Possible bearish price movement towards the support 1270.7000 within the next 3 days. Supported by RSI above 60 Chart 1 hourPattern Falling WedgeLength 238 CandlesIdentified 22-Apr-2019 14:00 UTC
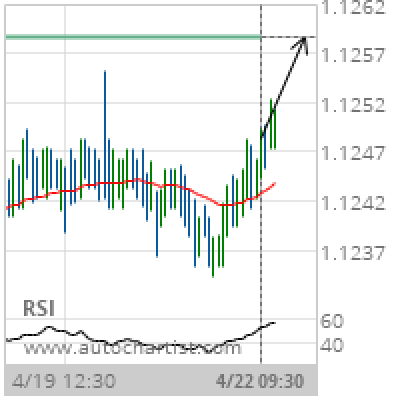
EUR/USD Target Level: 1.1258
Approaching Resistance level of 1.1258 identified at 22-Apr-2019 09:30 UTC Supported by Upward sloping Moving Average Chart 30 MinutesPattern ResistanceLength 92 CandlesIdentified 22-Apr-2019 09:30 UTC
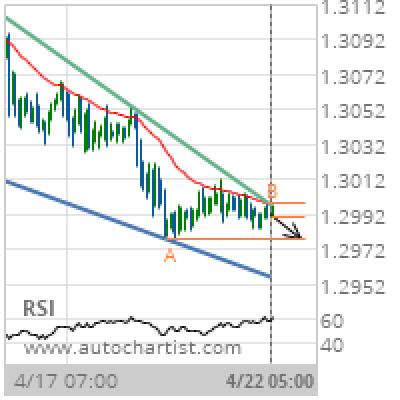
GBP/USD Target Level: 1.2978
Falling Wedge identified at 22-Apr-2019 05:00 UTC. This pattern is still in the process of forming. Possible bearish price movement towards the support 1.2978 within the next 2 days. Supported by RSI above 60 Chart 1 hourPattern Falling WedgeLength 152 CandlesIdentified 22-Apr-2019 05:00 UTC
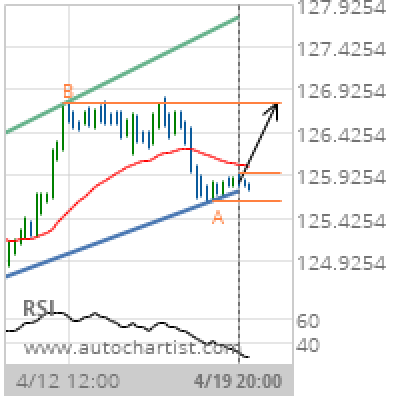
EUR/JPY Target Level: 126.7650
Channel Up identified at 19-Apr-2019 20:00 UTC. This pattern is still in the process of forming. Possible bullish price movement towards the resistance 126.7650 within the next 2 days. Supported by RSI below 40 Chart 4 hourPattern Channel UpLength 76 CandlesIdentified 19-Apr-2019 20:00 UTC
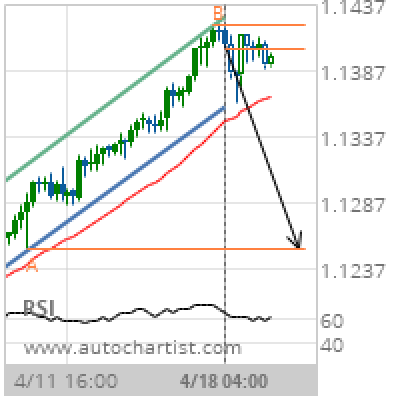
EUR/CHF Target Level: 1.1252
Channel Up identified at 18-Apr-2019 04:00 UTC. This pattern is still in the process of forming. Possible bearish price movement towards the support 1.1252 within the next 2 days. Supported by RSI above 60 Chart 4 hourPattern Channel UpLength 66 CandlesIdentified 18-Apr-2019 04:00 UTC
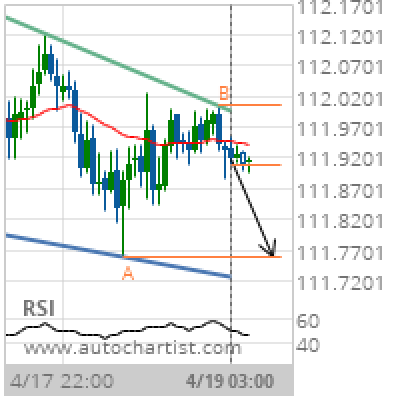
USD/JPY Target Level: 111.7590
Falling Wedge identified at 19-Apr-2019 03:00 UTC. This pattern is still in the process of forming. Possible bearish price movement towards the support 111.7590 within the next 18 hours. Supported by Downward sloping Moving Average Chart 1 hourPattern Falling WedgeLength 65 CandlesIdentified 19-Apr-2019 03:00 UTC