
Browsing Category
Uncategorized
616 messages
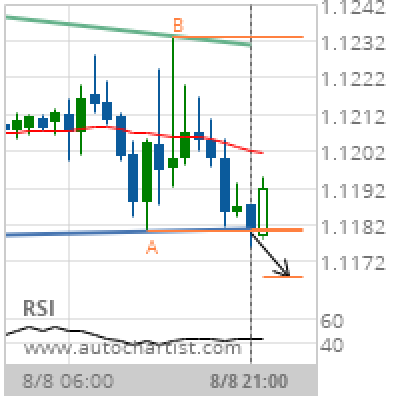
EUR/USD Target Level: 1.1168
Descending Triangle has broken through the support line at 08-Aug-2019 21:00 UTC. Possible bearish price movement forecast for the next 10 hours towards 1.1168. Supported by Downward sloping Moving Average Chart 1 hourPattern Descending TriangleLength 34 CandlesIdentified 08-Aug-2019 21:00 UTC
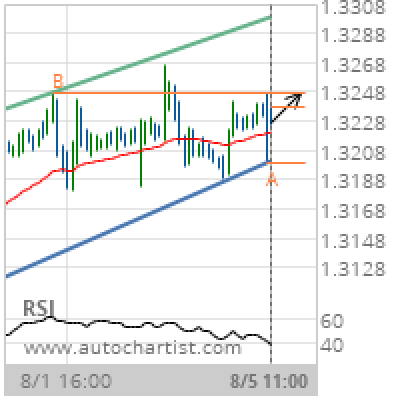
USD/CAD Target Level: 1.3247
Channel Up identified at 05-Aug-2019 11:00 UTC. This pattern is still in the process of forming. Possible bullish price movement towards the resistance 1.3247 within the next day. Supported by RSI below 40 Chart 1 hourPattern Channel UpLength 93 CandlesIdentified 05-Aug-2019 11:00 UTC
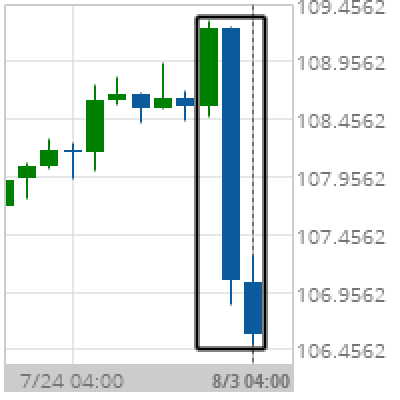
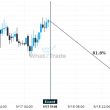
Big Movement USD/JPY
USD/JPY experienced a 1.82% bearish movement in the last 3 days. Chart DailyPattern Big MovementLength 3 CandlesIdentified 03-Aug-2019 04:00 UTC
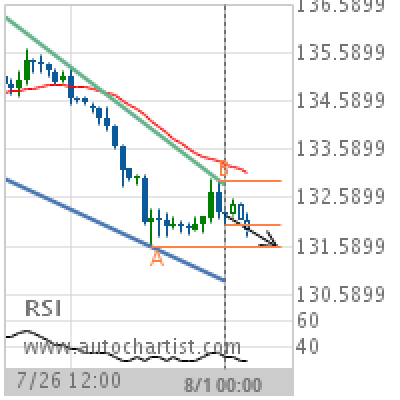
GBP/JPY Target Level: 131.5800
Falling Wedge identified at 01-Aug-2019 00:00 UTC. This pattern is still in the process of forming. Possible bearish price movement towards the support 131.5800 within the next 2 days. Supported by Downward sloping Moving Average Chart 4 hourPattern Falling WedgeLength 52 CandlesIdentified 01-Aug-2019 00:00 UTC
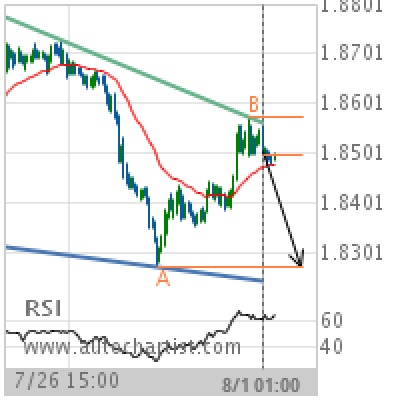
GBP/NZD Target Level: 1.8274
Falling Wedge identified at 01-Aug-2019 01:00 UTC. This pattern is still in the process of forming. Possible bearish price movement towards the support 1.8274 within the next 2 days. Supported by RSI above 60 Chart 1 hourPattern Falling WedgeLength 181 CandlesIdentified 01-Aug-2019 01:00 UTC
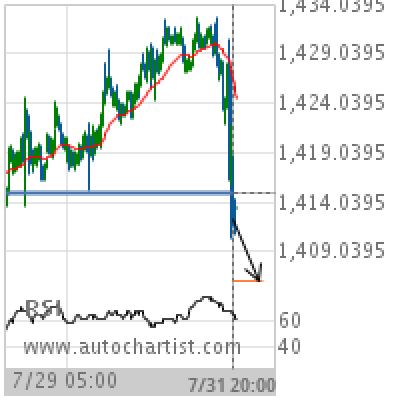
XAU/USD Target Level: 1406.1200
Broke through Support level of 1414.9000 at 31-Jul-2019 20:00 UTC Supported by RSI above 60 Chart 30 MinutesPattern SupportLength 284 CandlesIdentified 31-Jul-2019 20:00 UTC
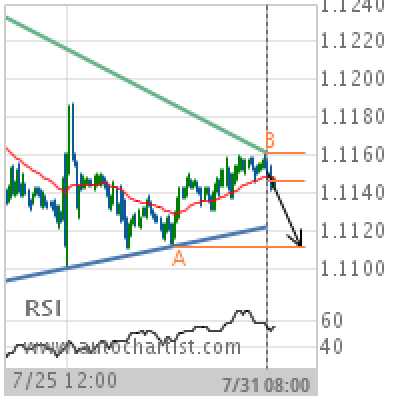
EUR/USD Target Level: 1.1112
Triangle identified at 31-Jul-2019 08:00 UTC. This pattern is still in the process of forming. Possible bearish price movement towards the support 1.1112 within the next 3 days. Supported by Downward sloping Moving Average Chart 1 hourPattern TriangleLength 201 CandlesIdentified 31-Jul-2019 08:00 UTC
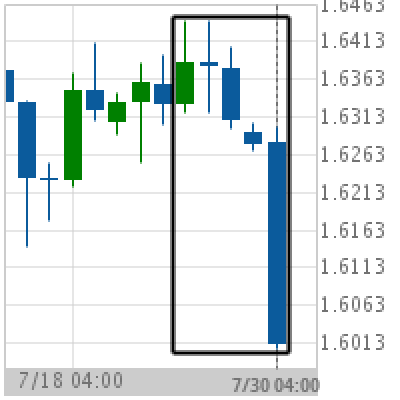
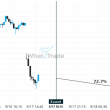
Big Movement GBP/CAD
GBP/CAD experienced a 1.94% bearish movement in the last 6 days. Chart DailyPattern Big MovementLength 5 CandlesIdentified 30-Jul-2019 04:00 UTC
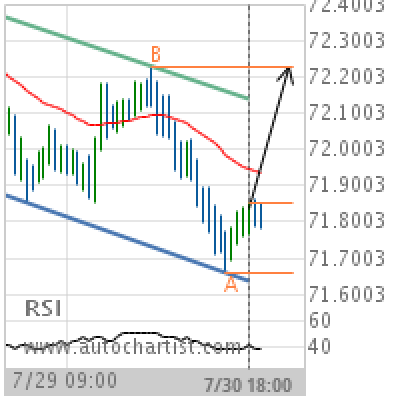
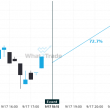
NZD/JPY Target Level: 72.2290
Channel Down identified at 30-Jul-2019 18:00 UTC. This pattern is still in the process of forming. Possible bullish price movement towards the resistance 72.2290 within the next 23 hours. Supported by RSI below 40 Chart 1 hourPattern Channel DownLength 74 CandlesIdentified 30-Jul-2019 18:00 UTC
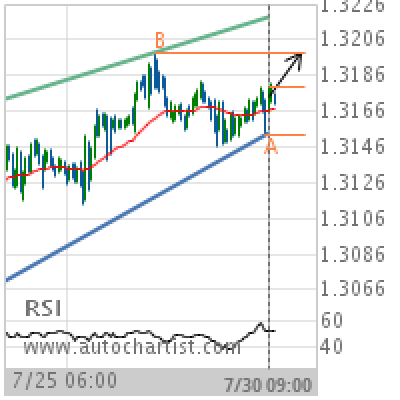
USD/CAD Target Level: 1.3199
Rising Wedge identified at 30-Jul-2019 09:00 UTC. This pattern is still in the process of forming. Possible bullish price movement towards the resistance 1.3199 within the next 2 days. Supported by Upward sloping Moving Average Chart 1 hourPattern Rising WedgeLength 164 CandlesIdentified 30-Jul-2019 09:00 UTC