
Browsing Category
Uncategorized
616 messages
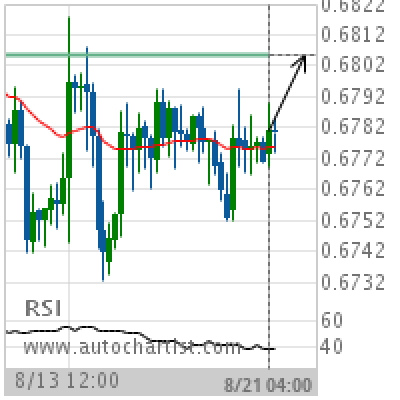
AUD/USD Target Level: 0.6806
Approaching Resistance level of 0.6806 identified at 21-Aug-2019 04:00 UTC Supported by RSI below 40 Chart 4 hourPattern ResistanceLength 78 CandlesIdentified 21-Aug-2019 04:00 UTC
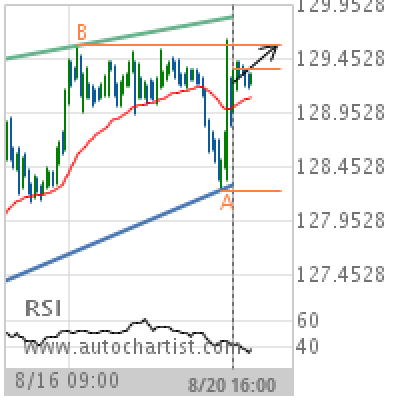
GBP/JPY Target Level: 129.5730
Rising Wedge identified at 20-Aug-2019 16:00 UTC. This pattern is still in the process of forming. Possible bullish price movement towards the resistance 129.5730 within the next 2 days. Supported by RSI below 40 Chart 1 hourPattern Rising WedgeLength 128 CandlesIdentified 20-Aug-2019 16:00 UTC
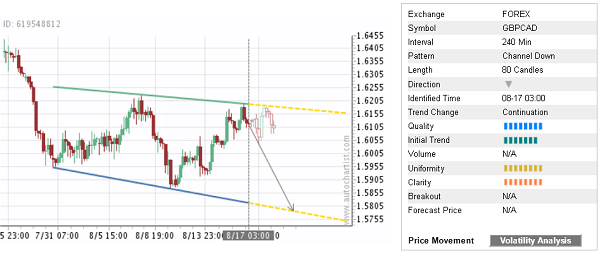
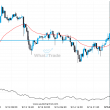
Trade of the Day: GBP/CAD
By: Dima Chernovolov GBP/CAD continues to fall inside the 4-hour Down Channel chart pattern which was identified previously by Autochartist. Autochartist rates the quality of this Down Channel at the 8-bar level – which is the result of the fast Initial Trend (7 bars) and strong medium Uniformity and Clarity (8 bars). GBP/CAD is expected…
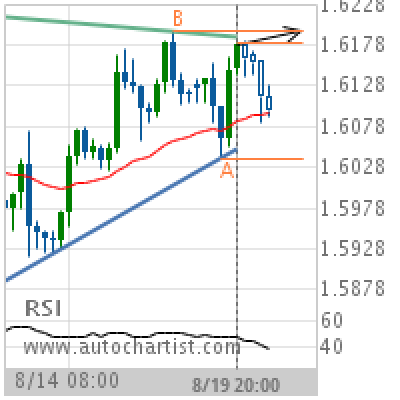
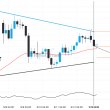
GBP/CAD Target Level: 1.6194
Triangle identified at 19-Aug-2019 20:00 UTC. This pattern is still in the process of forming. Possible bullish price movement towards the resistance 1.6194 within the next 2 days. Supported by RSI below 40 Chart 4 hourPattern TriangleLength 50 CandlesIdentified 19-Aug-2019 20:00 UTC
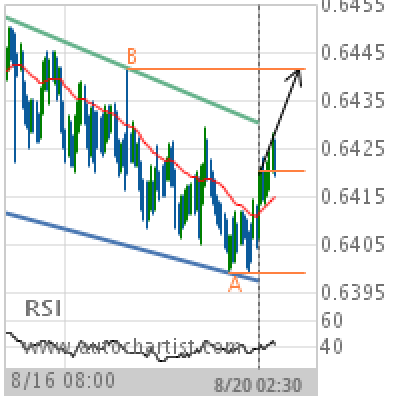
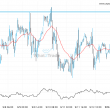
NZD/USD Target Level: 0.6442
Channel Down identified at 20-Aug-2019 02:30 UTC. This pattern is still in the process of forming. Possible bullish price movement towards the resistance 0.6442 within the next day. Supported by Upward sloping Moving Average Chart 30 MinutesPattern Channel DownLength 188 CandlesIdentified 20-Aug-2019 02:30 UTC
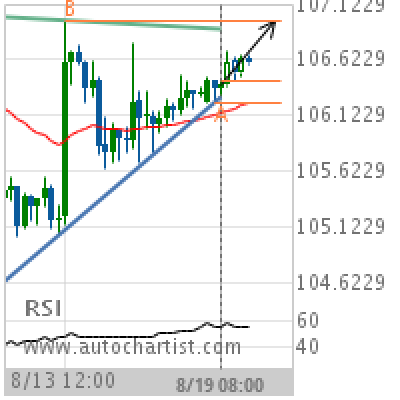
USD/JPY Target Level: 106.9740
Triangle identified at 19-Aug-2019 08:00 UTC. This pattern is still in the process of forming. Possible bullish price movement towards the resistance 106.9740 within the next 2 days. Supported by Upward sloping Moving Average Chart 4 hourPattern TriangleLength 56 CandlesIdentified 19-Aug-2019 08:00 UTC
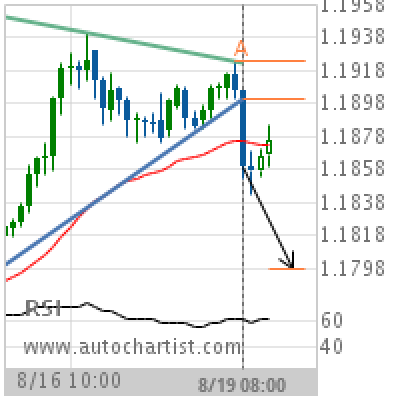
GBP/CHF Target Level: 1.1798
Triangle has broken through the support line at 19-Aug-2019 08:00 UTC. Possible bearish price movement forecast for the next 13 hours towards 1.1798. Supported by RSI above 60 Chart 1 hourPattern TriangleLength 50 CandlesIdentified 19-Aug-2019 08:00 UTC
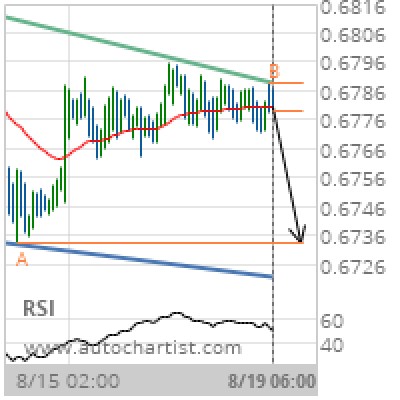
AUD/USD Target Level: 0.6733
Falling Wedge identified at 19-Aug-2019 06:00 UTC. This pattern is still in the process of forming. Possible bearish price movement towards the support 0.6733 within the next 2 days. Supported by Downward sloping Moving Average Chart 1 hourPattern Falling WedgeLength 114 CandlesIdentified 19-Aug-2019 06:00 UTC
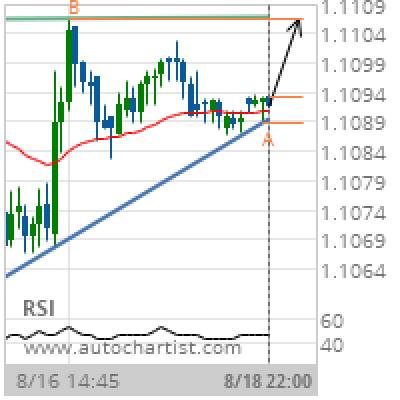
EUR/USD Target Level: 1.1107
Ascending Triangle identified at 18-Aug-2019 22:00 UTC. This pattern is still in the process of forming. Possible bullish price movement towards the resistance 1.1107 within the next 5 hours. Supported by Upward sloping Moving Average Chart 15 MinutesPattern Ascending TriangleLength 63 CandlesIdentified 18-Aug-2019 22:00 UTC
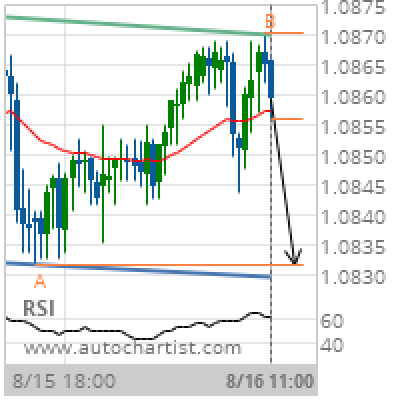
EUR/CHF Target Level: 1.0832
Channel Down identified at 16-Aug-2019 11:00 UTC. This pattern is still in the process of forming. Possible bearish price movement towards the support 1.0832 within the next 12 hours. Supported by RSI above 60 Chart 30 MinutesPattern Channel DownLength 74 CandlesIdentified 16-Aug-2019 11:00 UTC