


Browsing Category
Uncategorized
616 messages
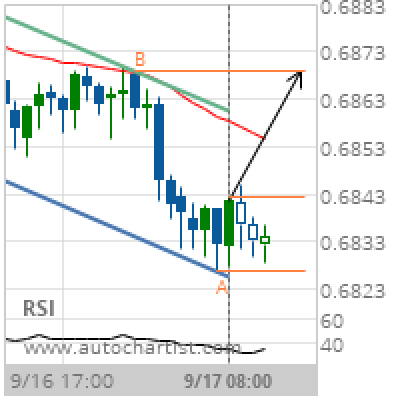
AUD/USD Target Level: 0.6869
Channel Down identified at 17-Sep-2019 08:00 UTC. This pattern is still in the process of forming. Possible bullish price movement towards the resistance 0.6869 within the next 8 hours. Supported by RSI below 40 Chart 1 hourPattern Channel DownLength 34 CandlesIdentified 17-Sep-2019 08:00 UTC
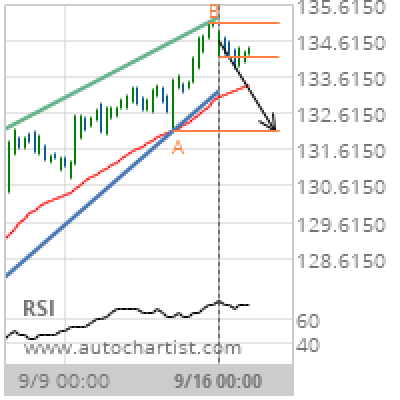
GBP/JPY Target Level: 132.1400
Rising Wedge identified at 16-Sep-2019 00:00 UTC. This pattern is still in the process of forming. Possible bearish price movement towards the support 132.1400 within the next 3 days. Supported by RSI above 60 Chart 4 hourPattern Rising WedgeLength 71 CandlesIdentified 16-Sep-2019 00:00 UTC
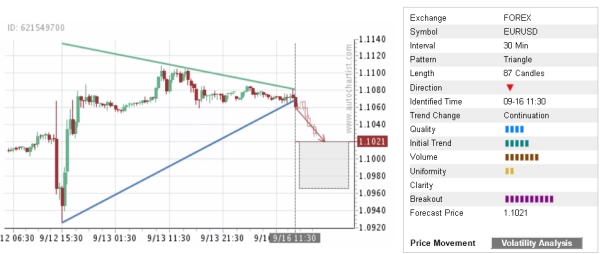
Trade of the Day: EUR/USD
By: Dima Chernovolov EUR/USD recently broke the 30-minute Triangle chart pattern which was identified previously by Autochartist. Autochartist rates the quality of this Triangle at the 4-bar level – which reflects the medium Initial Trend (5 bars) and lower Uniformity (2 bars). EUR/USD is expected to fall toward the forecast price 1.1021 – in line…
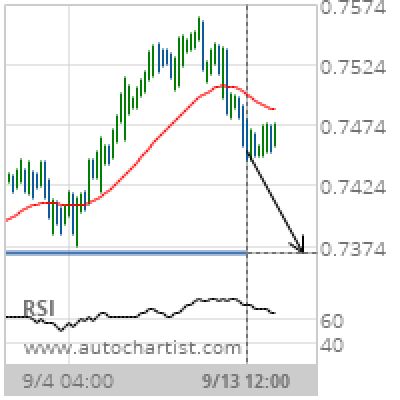
CAD/CHF Target Level: 0.7368
Approaching Support level of 0.7368 identified at 13-Sep-2019 12:00 UTC Supported by RSI above 60 Chart 4 hourPattern SupportLength 101 CandlesIdentified 13-Sep-2019 12:00 UTC
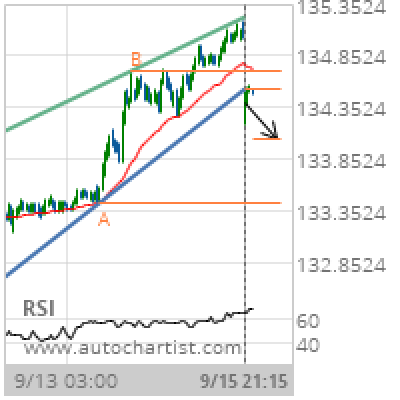
GBP/JPY Target Level: 134.0445
Rising Wedge has broken through the support line at 15-Sep-2019 21:15 UTC. Possible bearish price movement forecast for the next 13 hours towards 134.0445. Supported by RSI above 60 Chart 15 MinutesPattern Rising WedgeLength 165 CandlesIdentified 15-Sep-2019 21:15 UTC
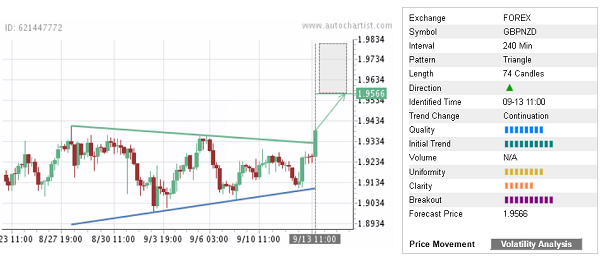
Trade of the Day: GBP/NZD
By: Dima Chernovolov GBP/NZD recently broke the 4-hour Triangle chart pattern which was identified previously by Autochartist. Autochartist rates the quality of this Triangle at the 8-bar level – which reflects the sharp Initial Trend (10 bars), significant Uniformity (8 bars) and lower Clarity (6 bars). GBP/NZD is expected to rise toward the forecast price…
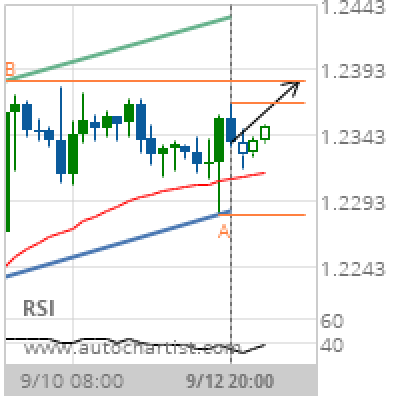
GBP/USD Target Level: 1.2385
Channel Up identified at 12-Sep-2019 20:00 UTC. This pattern is still in the process of forming. Possible bullish price movement towards the resistance 1.2385 within the next day. Supported by RSI below 40 Chart 4 hourPattern Channel UpLength 33 CandlesIdentified 12-Sep-2019 20:00 UTC
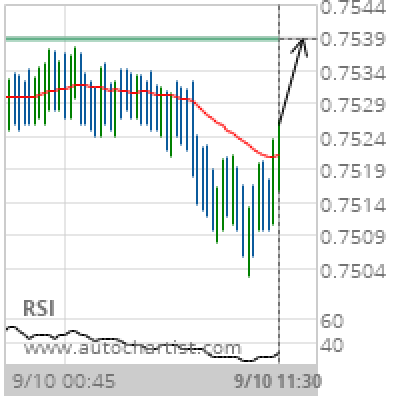
CAD/CHF Target Level: 0.7539
Approaching Resistance level of 0.7539 identified at 10-Sep-2019 11:30 UTC Supported by RSI below 40 Chart 15 MinutesPattern ResistanceLength 91 CandlesIdentified 10-Sep-2019 11:30 UTC
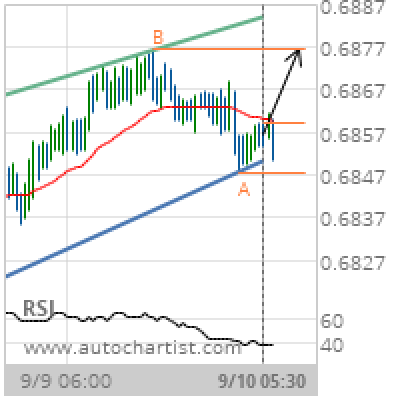
AUD/USD Target Level: 0.6876
Channel Up identified at 10-Sep-2019 05:30 UTC. This pattern is still in the process of forming. Possible bullish price movement towards the resistance 0.6876 within the next 17 hours. Supported by RSI below 40 Chart 30 MinutesPattern Channel UpLength 103 CandlesIdentified 10-Sep-2019 05:30 UTC
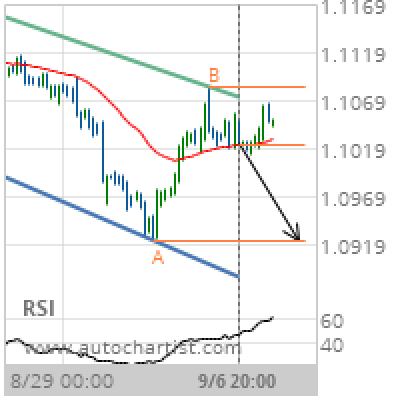
EUR/USD Target Level: 1.0925
Channel Down identified at 06-Sep-2019 20:00 UTC. This pattern is still in the process of forming. Possible bearish price movement towards the support 1.0925 within the next 2 days. Supported by RSI above 60 Chart 4 hourPattern Channel DownLength 94 CandlesIdentified 06-Sep-2019 20:00 UTC