


Browsing Category
Uncategorized
616 messages
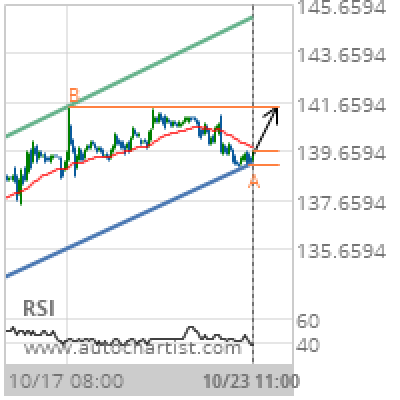
GBP/JPY Target Level: 141.4900
Channel Up identified at 23-Oct-2019 11:00 UTC. This pattern is still in the process of forming. Possible bullish price movement towards the resistance 141.4900 within the next 3 days. Supported by RSI below 40 Chart 1 hourPattern Channel UpLength 209 CandlesIdentified 23-Oct-2019 11:00 UTC
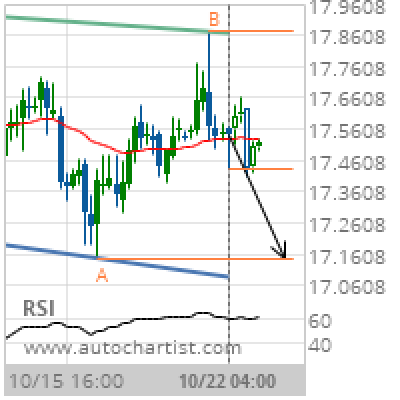
XAG/USD Target Level: 17.1470
Channel Down identified at 22-Oct-2019 04:00 UTC. This pattern is still in the process of forming. Possible bearish price movement towards the support 17.1470 within the next 3 days. Supported by RSI above 60 Chart 4 hourPattern Channel DownLength 61 CandlesIdentified 22-Oct-2019 04:00 UTC
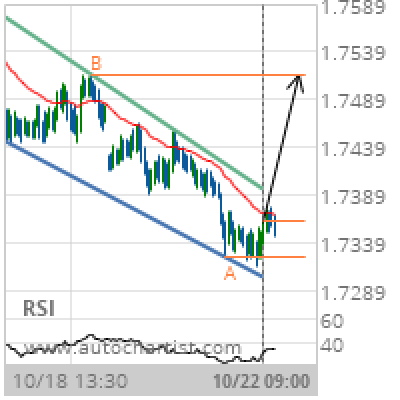
EUR/NZD Target Level: 1.7515
Channel Down identified at 22-Oct-2019 09:00 UTC. This pattern is still in the process of forming. Possible bullish price movement towards the resistance 1.7515 within the next day. Supported by RSI below 40 Chart 30 MinutesPattern Channel DownLength 172 CandlesIdentified 22-Oct-2019 09:00 UTC
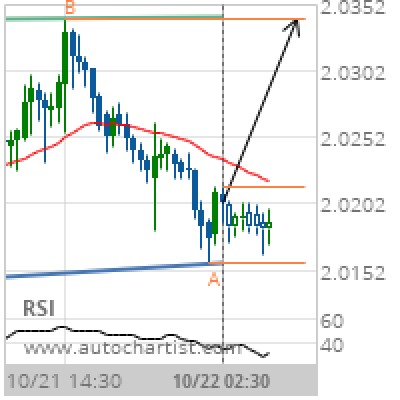
GBP/NZD Target Level: 2.0341
Ascending Triangle identified at 22-Oct-2019 02:30 UTC. This pattern is still in the process of forming. Possible bullish price movement towards the resistance 2.0341 within the next 6 hours. Supported by RSI below 40 Chart 30 MinutesPattern Ascending TriangleLength 56 CandlesIdentified 22-Oct-2019 02:30 UTC
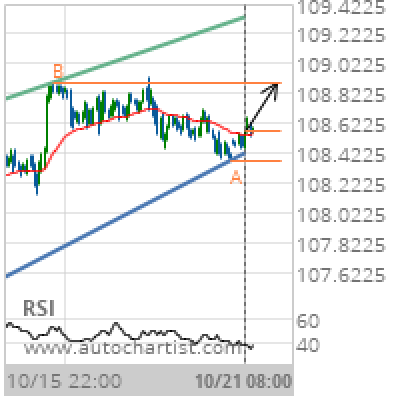
USD/JPY Target Level: 108.8980
Rising Wedge identified at 21-Oct-2019 08:00 UTC. This pattern is still in the process of forming. Possible bullish price movement towards the resistance 108.8980 within the next 2 days. Supported by RSI below 40 Chart 1 hourPattern Rising WedgeLength 171 CandlesIdentified 21-Oct-2019 08:00 UTC
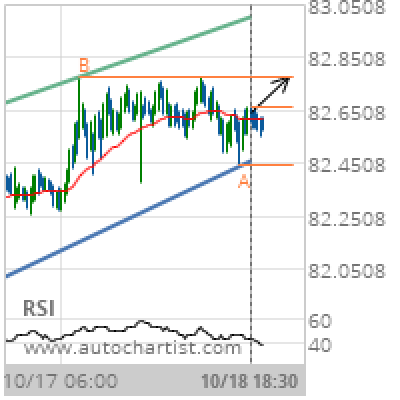
CAD/JPY Target Level: 82.7760
Channel Up identified at 18-Oct-2019 18:30 UTC. This pattern is still in the process of forming. Possible bullish price movement towards the resistance 82.7760 within the next 24 hours. Supported by RSI below 40 Chart 30 MinutesPattern Channel UpLength 159 CandlesIdentified 18-Oct-2019 18:30 UTC
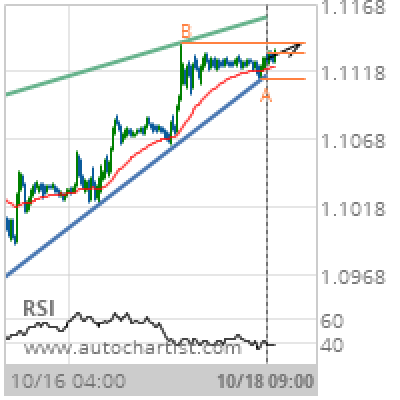
EUR/USD Target Level: 1.1140
Rising Wedge identified at 18-Oct-2019 09:00 UTC. This pattern is still in the process of forming. Possible bullish price movement towards the resistance 1.1140 within the next 2 days. Supported by RSI below 40 Chart 30 MinutesPattern Rising WedgeLength 235 CandlesIdentified 18-Oct-2019 09:00 UTC
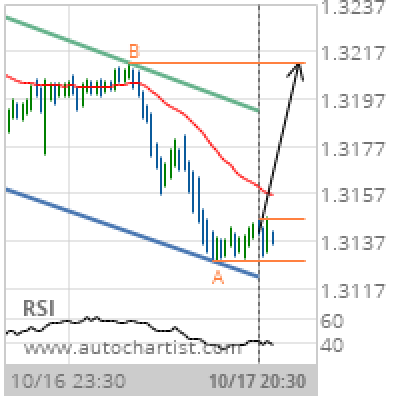
USD/CAD Target Level: 1.3212
Channel Down identified at 17-Oct-2019 20:30 UTC. This pattern is still in the process of forming. Possible bullish price movement towards the resistance 1.3212 within the next 14 hours. Supported by RSI below 40 Chart 30 MinutesPattern Channel DownLength 93 CandlesIdentified 17-Oct-2019 20:30 UTC
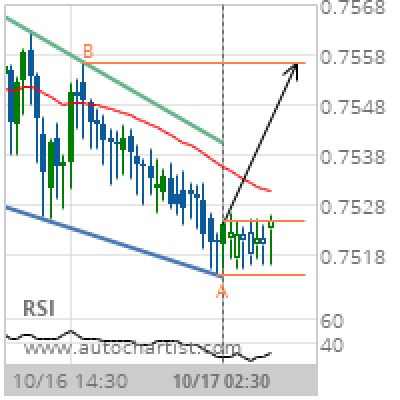
CAD/CHF Target Level: 0.7556
Falling Wedge identified at 17-Oct-2019 02:30 UTC. This pattern is still in the process of forming. Possible bullish price movement towards the resistance 0.7556 within the next 6 hours. Supported by RSI below 40 Chart 30 MinutesPattern Falling WedgeLength 57 CandlesIdentified 17-Oct-2019 02:30 UTC
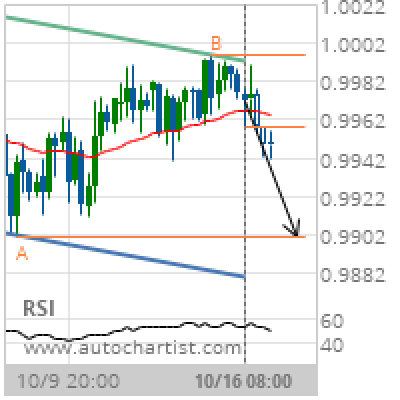
USD/CHF Target Level: 0.9902
Channel Down identified at 16-Oct-2019 08:00 UTC. This pattern is still in the process of forming. Possible bearish price movement towards the support 0.9902 within the next 3 days. Supported by Downward sloping Moving Average Chart 4 hourPattern Channel DownLength 63 CandlesIdentified 16-Oct-2019 08:00 UTC