


Browsing Category
Uncategorized
616 messages
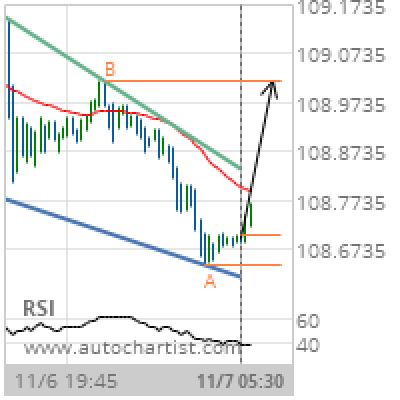
USD/JPY Target Level: 109.0150
Falling Wedge identified at 07-Nov-2019 05:30 UTC. This pattern is still in the process of forming. Possible bullish price movement towards the resistance 109.0150 within the next 7 hours. Supported by RSI below 40 Chart 15 MinutesPattern Falling WedgeLength 89 CandlesIdentified 07-Nov-2019 05:30 UTC
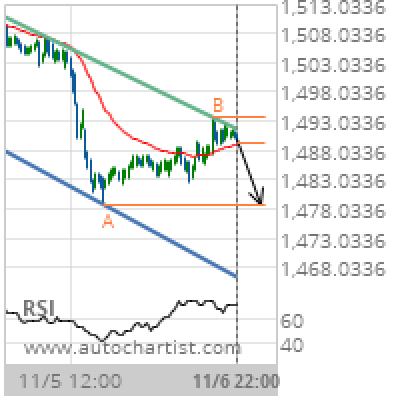
XAU/USD Target Level: 1478.8000
Channel Down identified at 06-Nov-2019 22:00 UTC. This pattern is still in the process of forming. Possible bearish price movement towards the support 1478.8000 within the next day. Supported by RSI above 60 Chart 30 MinutesPattern Channel DownLength 156 CandlesIdentified 06-Nov-2019 22:00 UTC
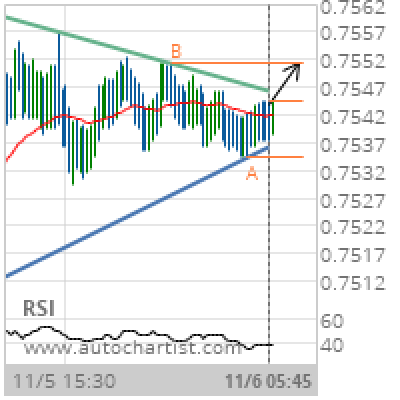
CAD/CHF Target Level: 0.7551
Triangle identified at 06-Nov-2019 05:45 UTC. This pattern is still in the process of forming. Possible bullish price movement towards the resistance 0.7551 within the next 10 hours. Supported by RSI below 40 Chart 15 MinutesPattern TriangleLength 124 CandlesIdentified 06-Nov-2019 05:45 UTC
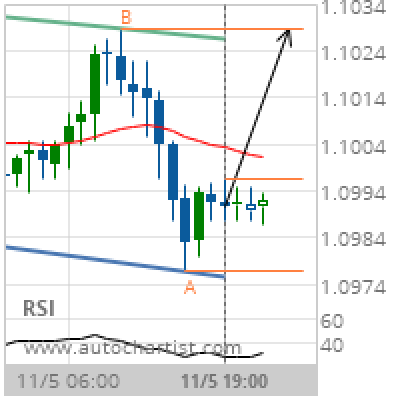
EUR/CHF Target Level: 1.1029
Channel Down identified at 05-Nov-2019 19:00 UTC. This pattern is still in the process of forming. Possible bullish price movement towards the resistance 1.1029 within the next 6 hours. Supported by RSI below 40 Chart 1 hourPattern Channel DownLength 30 CandlesIdentified 05-Nov-2019 19:00 UTC
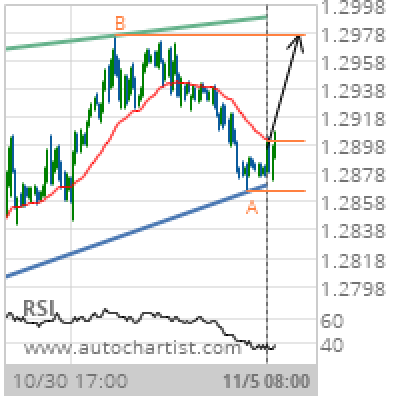
GBP/USD Target Level: 1.2976
Rising Wedge identified at 05-Nov-2019 08:00 UTC. This pattern is still in the process of forming. Possible bullish price movement towards the resistance 1.2976 within the next 3 days. Supported by RSI below 40 Chart 1 hourPattern Rising WedgeLength 191 CandlesIdentified 05-Nov-2019 08:00 UTC
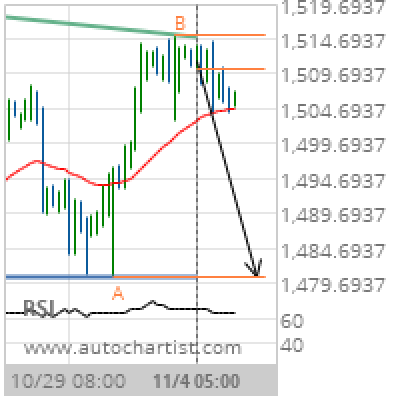
XAU/USD Target Level: 1480.6000
Descending Triangle identified at 04-Nov-2019 05:00 UTC. This pattern is still in the process of forming. Possible bearish price movement towards the support 1480.6000 within the next 2 days. Supported by RSI above 60 Chart 4 hourPattern Descending TriangleLength 60 CandlesIdentified 04-Nov-2019 05:00 UTC
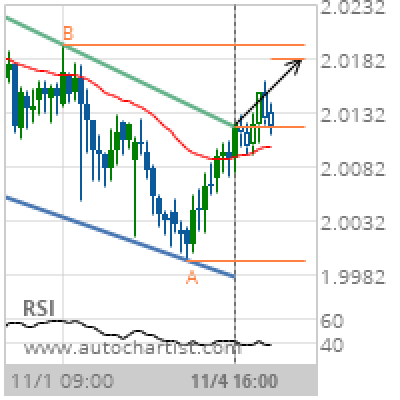
GBP/NZD Target Level: 2.0180
Channel Down has broken through the resistance line at 04-Nov-2019 16:00 UTC. Possible bullish price movement forecast for the next 16 hours towards 2.0180. Supported by RSI below 40 Chart 1 hourPattern Channel DownLength 68 CandlesIdentified 04-Nov-2019 16:00 UTC
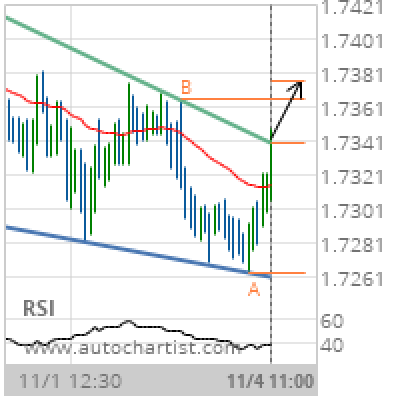
EUR/NZD Target Level: 1.7377
Falling Wedge has broken through the resistance line at 04-Nov-2019 11:00 UTC. Possible bullish price movement forecast for the next 16 hours towards 1.7377. Supported by RSI below 40 Chart 30 MinutesPattern Falling WedgeLength 96 CandlesIdentified 04-Nov-2019 11:00 UTC
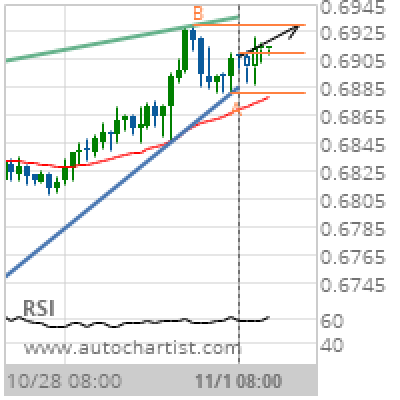
AUD/USD Target Level: 0.6930
Rising Wedge identified at 01-Nov-2019 08:00 UTC. This pattern is still in the process of forming. Possible bullish price movement towards the resistance 0.6930 within the next 2 days. Supported by Upward sloping Moving Average Chart 4 hourPattern Rising WedgeLength 54 CandlesIdentified 01-Nov-2019 08:00 UTC
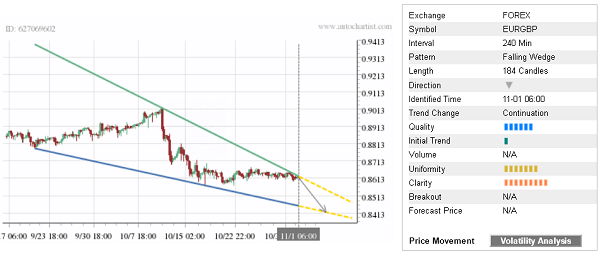
Trade of the Day: EUR/GBP
By: Dima Chernovolov EUR/GBP continues to fall inside the 4-hour Falling Wedge chart pattern which was identified previously by Autochartist. Autochartist rates the quality of this Falling Wedge at the 6-bar level – which is the result of the slow Initial Trend (1 bar), above-average Uniformity (6 bars) and near-maximum Clarity (9 bars). EUR/GBP is…