


Browsing Category
Uncategorized
616 messages
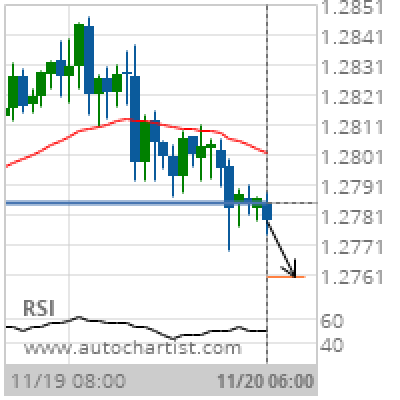
GBP/CHF Target Level: 1.2760
Broke through Support level of 1.2785 at 20-Nov-2019 06:00 UTC Supported by Downward sloping Moving Average Chart 1 hourPattern SupportLength 49 CandlesIdentified 20-Nov-2019 06:00 UTC
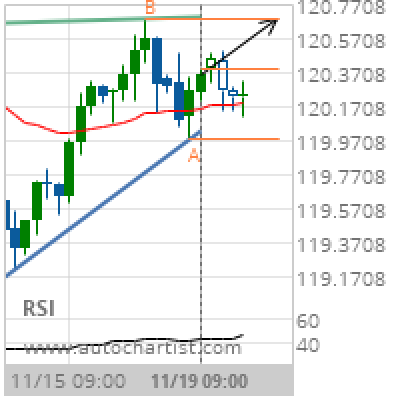
EUR/JPY Target Level: 120.6850
Ascending Triangle identified at 19-Nov-2019 09:00 UTC. This pattern is still in the process of forming. Possible bullish price movement towards the resistance 120.6850 within the next day. Supported by Upward sloping Moving Average Chart 4 hourPattern Ascending TriangleLength 31 CandlesIdentified 19-Nov-2019 09:00 UTC
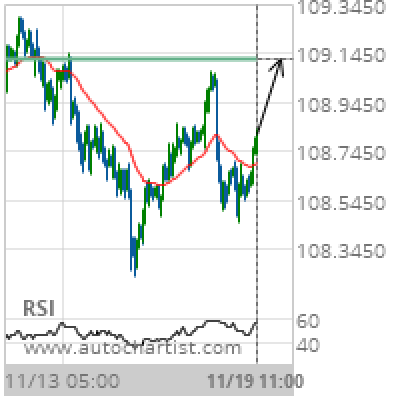
USD/JPY Target Level: 109.1210
Approaching Resistance level of 109.1210 identified at 19-Nov-2019 11:00 UTC Supported by Upward sloping Moving Average Chart 1 hourPattern ResistanceLength 222 CandlesIdentified 19-Nov-2019 11:00 UTC
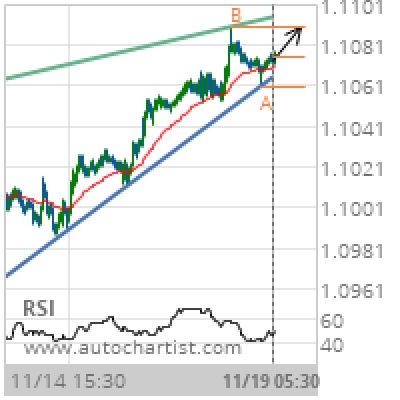
EUR/USD Target Level: 1.1090
Rising Wedge identified at 19-Nov-2019 05:30 UTC. This pattern is still in the process of forming. Possible bullish price movement towards the resistance 1.1090 within the next 2 days. Supported by Upward sloping Moving Average Chart 30 MinutesPattern Rising WedgeLength 272 CandlesIdentified 19-Nov-2019 05:30 UTC
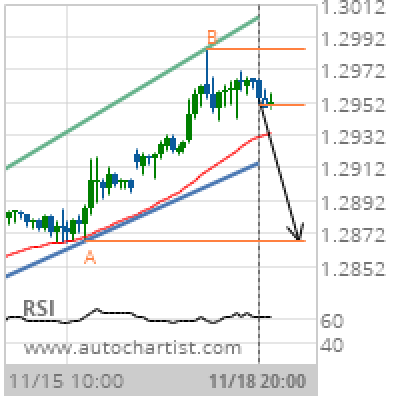
GBP/USD Target Level: 1.2868
Channel Up identified at 18-Nov-2019 20:00 UTC. This pattern is still in the process of forming. Possible bearish price movement towards the support 1.2868 within the next 22 hours. Supported by RSI above 60 Chart 1 hourPattern Channel UpLength 75 CandlesIdentified 18-Nov-2019 20:00 UTC
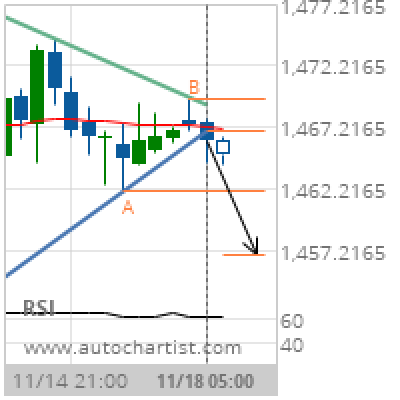
XAU/USD Target Level: 1456.7888
Pennant has broken through the support line at 18-Nov-2019 05:00 UTC. Possible bearish price movement forecast for the next day towards 1456.7888. Supported by RSI above 60 Chart 4 hourPattern PennantLength 22 CandlesIdentified 18-Nov-2019 05:00 UTC
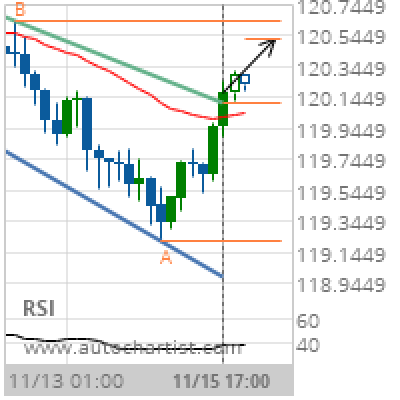
EUR/JPY Target Level: 120.5191
Channel Down has broken through the resistance line at 15-Nov-2019 17:00 UTC. Possible bullish price movement forecast for the next 2 days towards 120.5191. Supported by RSI below 40 Chart 4 hourPattern Channel DownLength 38 CandlesIdentified 15-Nov-2019 17:00 UTC
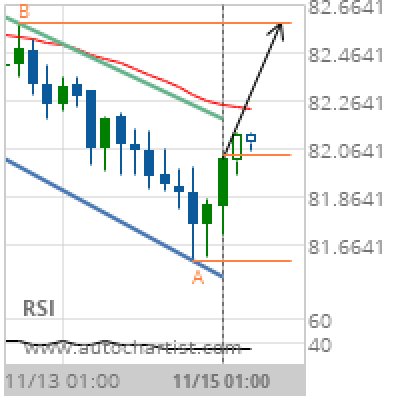
CAD/JPY Target Level: 82.5820
Flag identified at 15-Nov-2019 01:00 UTC. This pattern is still in the process of forming. Possible bullish price movement towards the resistance 82.5820 within the next day. Supported by RSI below 40 Chart 4 hourPattern FlagLength 28 CandlesIdentified 15-Nov-2019 01:00 UTC
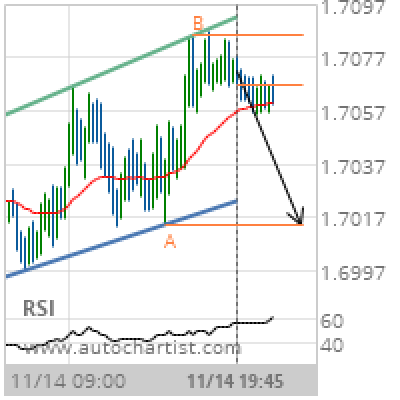
GBP/CAD Target Level: 1.7014
Channel Up identified at 14-Nov-2019 19:45 UTC. This pattern is still in the process of forming. Possible bearish price movement towards the support 1.7014 within the next 6 hours. Supported by RSI above 60 Chart 15 MinutesPattern Channel UpLength 99 CandlesIdentified 14-Nov-2019 19:45 UTC
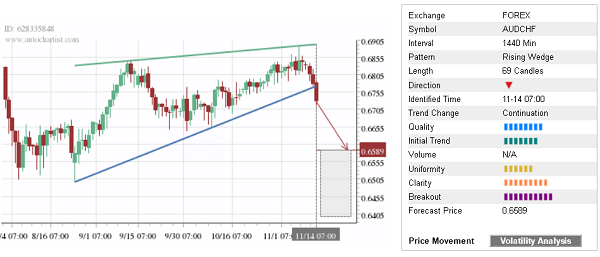
Trade of the Day: AUD/CHF
By: Dima Chernovolov AUD/CHF recently broke the daily Rising Wedge chart pattern which was identified previously by Autochartist. Autochartist rates the quality of this Rising Wedge at the 9-bar level – which is the result of the strong Initial Trend (7 bars), above-average Uniformity (6 bars) and near-maximum Clarity (9 bars). AUD/CHF is expected to…