


Browsing Category
Uncategorized
616 messages
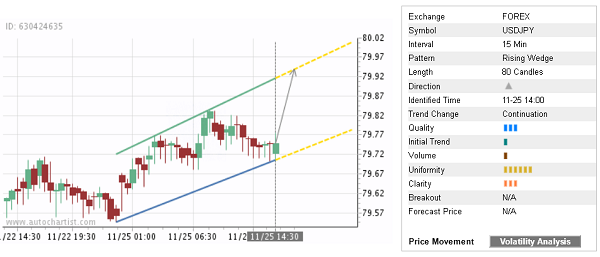
Trade of the Day: USD/JPY
By: Dima Chernovolov USD/JPY continues to rise inside the 15-minute Up Channel chart pattern which was identified recently by Autochartist. Autochartist rates the quality of this Up Channel at the 3-bar level – which is the result of the slow Initial Trend (1 bar), medium Uniformity (6 bars) and lower Clarity (3 bars). USD/JPY is…
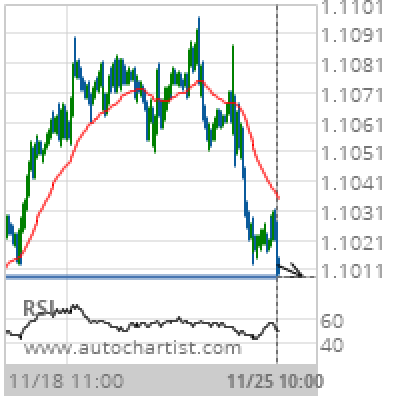
EUR/USD Target Level: 1.1009
Approaching Support level of 1.1009 identified at 25-Nov-2019 10:00 UTC Supported by Downward sloping Moving Average Chart 1 hourPattern SupportLength 257 CandlesIdentified 25-Nov-2019 10:00 UTC
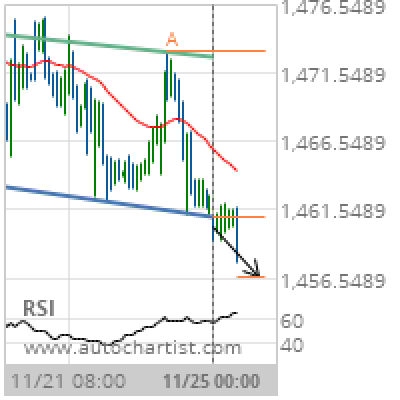
XAU/USD Target Level: 1456.6224
Head and Shoulders has broken through the support line at 25-Nov-2019 00:00 UTC. Possible bearish price movement forecast for the next day towards 1456.6224. Supported by RSI above 60 Chart 1 hourPattern Head and ShouldersLength 94 CandlesIdentified 25-Nov-2019 00:00 UTC
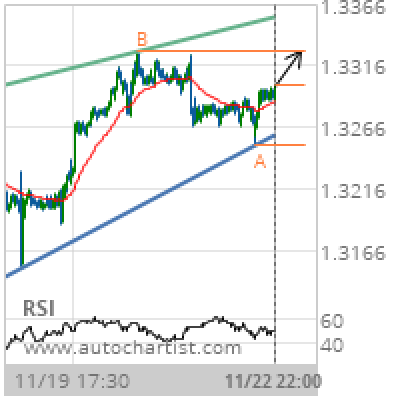
USD/CAD Target Level: 1.3327
Rising Wedge identified at 22-Nov-2019 22:00 UTC. This pattern is still in the process of forming. Possible bullish price movement towards the resistance 1.3327 within the next 2 days. Supported by Upward sloping Moving Average Chart 30 MinutesPattern Rising WedgeLength 342 CandlesIdentified 22-Nov-2019 22:00 UTC
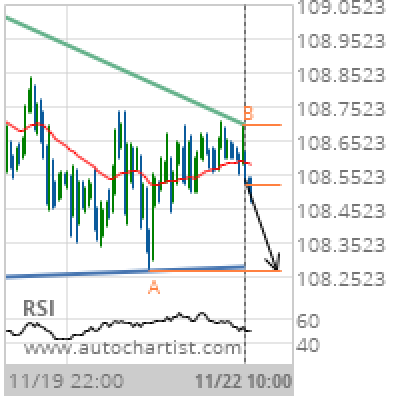
USD/JPY Target Level: 108.2700
Descending Triangle identified at 22-Nov-2019 10:00 UTC. This pattern is still in the process of forming. Possible bearish price movement towards the support 108.2700 within the next 2 days. Supported by Downward sloping Moving Average Chart 1 hourPattern Descending TriangleLength 135 CandlesIdentified 22-Nov-2019 10:00 UTC
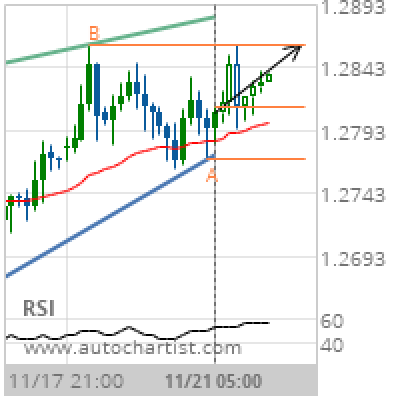
GBP/CHF Target Level: 1.2861
Rising Wedge identified at 21-Nov-2019 05:00 UTC. This pattern is still in the process of forming. Possible bullish price movement towards the resistance 1.2861 within the next day. Supported by Upward sloping Moving Average Chart 4 hourPattern Rising WedgeLength 47 CandlesIdentified 21-Nov-2019 05:00 UTC
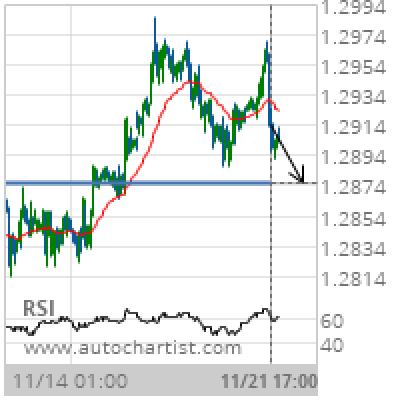
GBP/USD Target Level: 1.2876
Approaching Support level of 1.2876 identified at 21-Nov-2019 17:00 UTC Supported by RSI above 60 Chart 1 hourPattern SupportLength 302 CandlesIdentified 21-Nov-2019 17:00 UTC
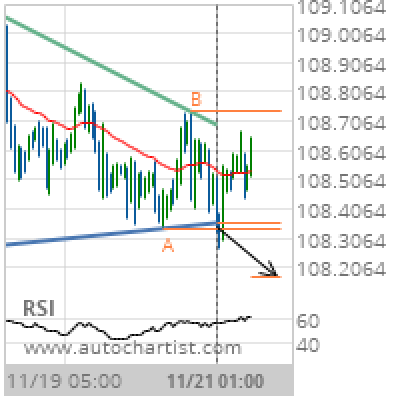
USD/JPY Target Level: 108.1742
Triangle has broken through the support line at 21-Nov-2019 01:00 UTC. Possible bearish price movement forecast for the next 23 hours towards 108.1742. Supported by RSI above 60 Chart 1 hourPattern TriangleLength 102 CandlesIdentified 21-Nov-2019 01:00 UTC
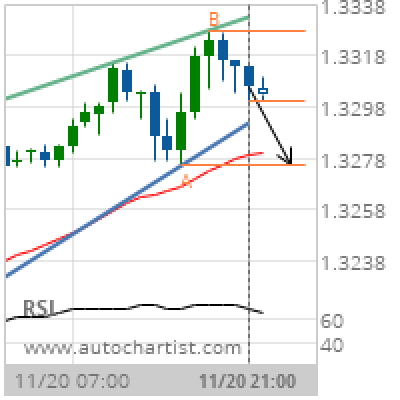
USD/CAD Target Level: 1.3275
Rising Wedge identified at 20-Nov-2019 21:00 UTC. This pattern is still in the process of forming. Possible bearish price movement towards the support 1.3275 within the next 9 hours. Supported by RSI above 60 Chart 1 hourPattern Rising WedgeLength 31 CandlesIdentified 20-Nov-2019 21:00 UTC
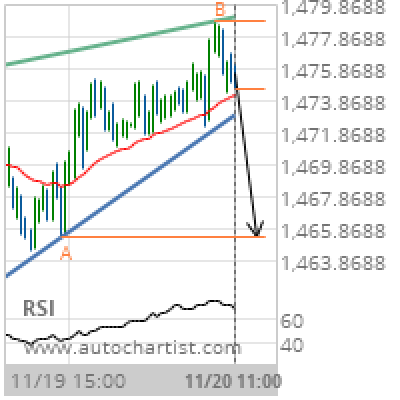
XAU/USD Target Level: 1465.3000
Rising Wedge identified at 20-Nov-2019 11:00 UTC. This pattern is still in the process of forming. Possible bearish price movement towards the support 1465.3000 within the next 15 hours. Supported by RSI above 60 Chart 30 MinutesPattern Rising WedgeLength 90 CandlesIdentified 20-Nov-2019 11:00 UTC