


Browsing Category
Indices mondiaux
7095 messages
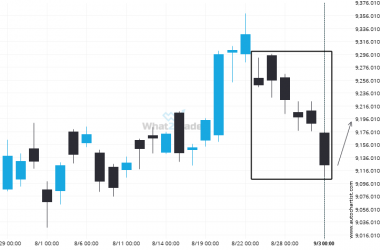
FTSE 100 posted 6 consecutive bearish Daily candles.
Rare candle sequence recorded on the FTSE 100 Daily chart, ending at 9123.4500.
After testing 9120.0000 numerous times, FTSE 100 has finally broken through. Can we expect a bearish trend to follow?
FTSE 100 has broken through a line of 9120.0000 and suggests a possible movement to 9079.4912 within the…
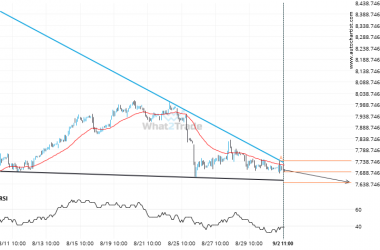
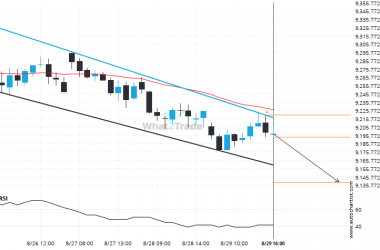
Important support line being approached by CAC 40. This price has been tested numerous time in the last 25 days
CAC 40 is approaching the support line of a Falling Wedge. It has touched this line numerous times…
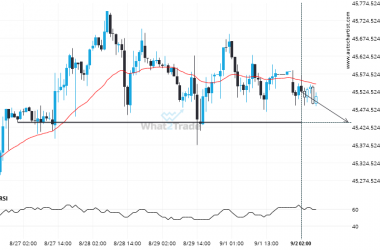
DOW 30 keeps moving closer towards 45437.7813. Will it finally breach this level?
A strong support level has been identified at 45437.7813 on the 1 hour DOW 30 chart. DOW 30…
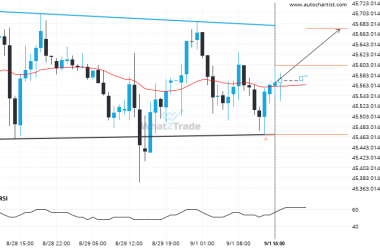
Because DOW 30 formed a Inverse Head and Shoulders pattern, we expect it to touch the resistance line. If it breaks through resistance it may move much higher
DOW 30 is moving towards a resistance line. Because we have seen it retrace from this line before,…
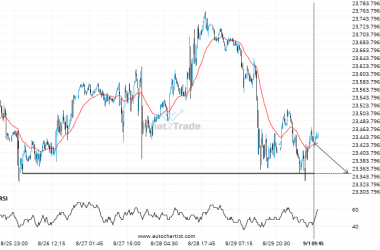
If you’re long NAS 100 you should be aware of the rapidly approaching level of 23349.5723
NAS 100 is moving towards a key support level at 23349.5723. NAS 100 has previously tested this level…
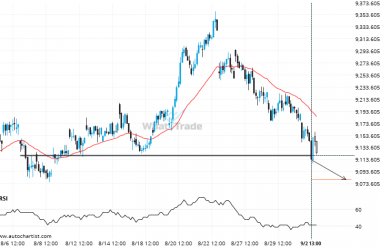
After testing the support line numerous times, FTSE 100 is once again approaching this line. Can we expect a bearish trend to follow?
FTSE 100 is approaching the support line of a Channel Down. It has touched this line numerous times…
Important price line being approached by ASX 200. This price has been tested numerous times before.
ASX 200 is moving towards a support line. Because we have seen it retrace from this level in…
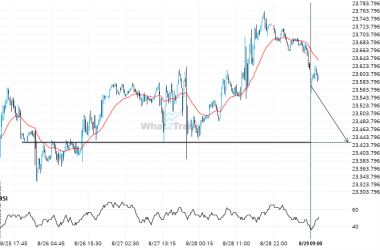
Supports and resistances are primary concepts of technical analysis. NAS 100 is heading for an important price of 23429.0117 – read about what this could mean for the future.
NAS 100 is heading towards a line of 23429.0117. If this movement continues, the price of NAS 100…
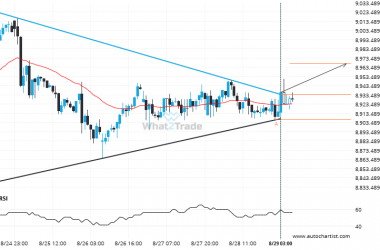
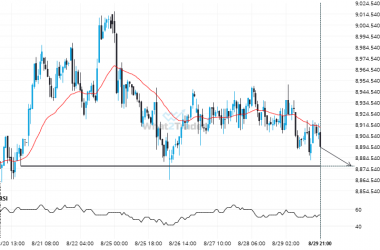
A possible move by ASX 200 towards 8967.3377
You would be well advised to confirm the breakout that has just occurred – do you believe the…