


Browsing Category
Indices mondiaux
7095 messages
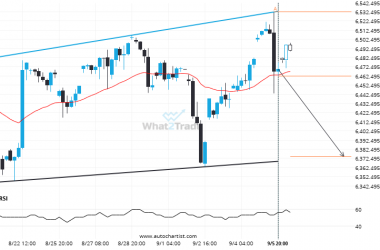
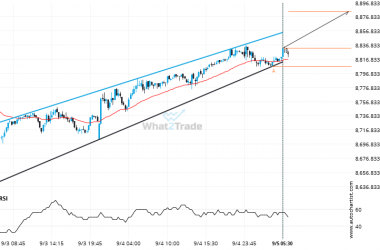
US 500 is quickly approaching the support line of a Channel Up. We expect either a breakout through this line or a rebound.
The movement of US 500 towards the support line of a Channel Up is yet another test of…
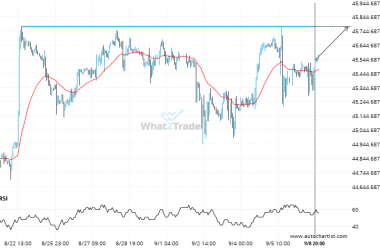
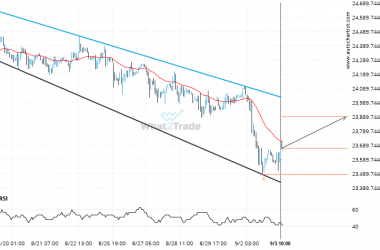
DOW 30 likely to test 45773.9102 in the near future. Where to next?
The movement of DOW 30 towards 45773.9102 price line is yet another test of the line it reached…
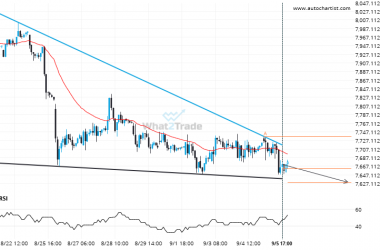
After testing the support line numerous times, CAC 40 is once again approaching this line. Can we expect a bearish trend to follow?
An emerging Falling Wedge has been detected on CAC 40 on the 1 hour chart. There is a…
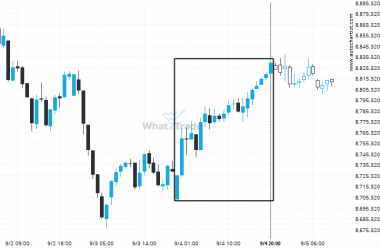
ASX 200 experienced a 1.19% bullish move in just 21 hours. The magnitude speaks for itself.
ASX 200 reached 8829.3 after a 1.19% move spanning 21 hours.
ASX 200 formed a Channel Up on the 15 Minutes chart. Retest of resistance in sight.
ASX 200 is moving towards a resistance line which it has tested numerous times in the past. We…
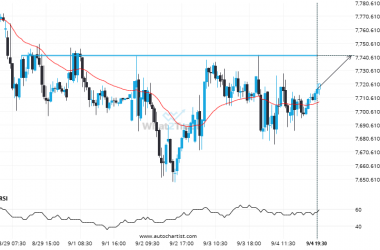
If CAC 40 touches 7741.7998 it may be time to take action.
The movement of CAC 40 towards 7741.7998 price line is yet another test of the line it reached…
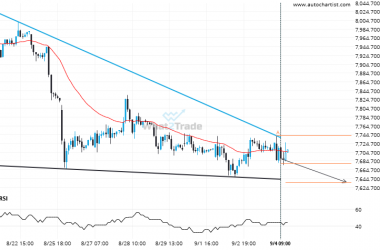
CAC 40 is approaching a support line of a Descending Triangle. It has touched this line numerous times in the last 14 days.
CAC 40 is heading towards the support line of a Descending Triangle. If this movement continues, the price…
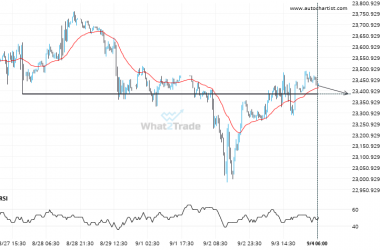
Important price line being approached by NAS 100. This price has been tested numerous times before.
NAS 100 is moving towards a support line. Because we have seen it retrace from this level in…
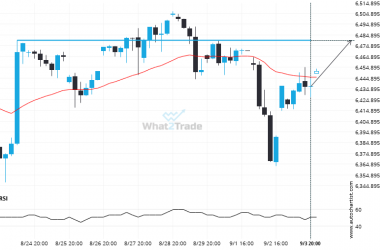
US 500 likely to test 6479.7700 in the near future. Where to next?
The movement of US 500 towards 6479.7700 price line is yet another test of the line it reached…
DAX 40 – approaching a resistance line that has been previously tested at least twice in the past
DAX 40 is moving towards a resistance line. Because we have seen it retrace from this line before,…