

Browsing Category
Indices mondiaux
6660 messages
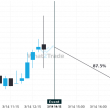
Could a large bearish move on FTSE 100 be a sign of things to come?
Those of you that are trend followers are probably eagerly watching FTSE 100 to see if its latest…
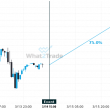
Nikkei 225 likely to test 38187.0000 in the near future. Where to next?
Nikkei 225 is approaching a support line at 38187.0000. If it hits the support line, it may break…
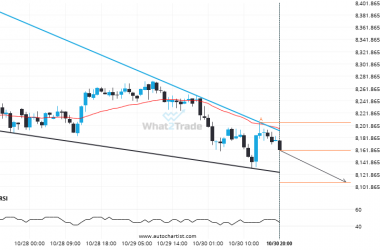
A Falling Wedge has formed, ASX 200 is approaching resistance. Can we expect a breakout and the start of a new trend or a reversal?
Emerging Falling Wedge detected on ASX 200 – the pattern is an emerging one and has not yet…
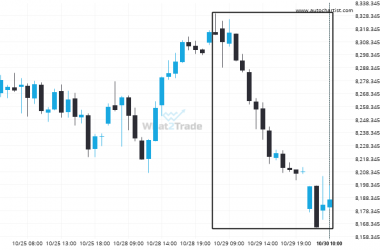
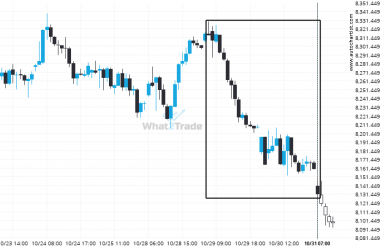
FTSE 100 moves lower to 8186.88 in the last 2 days.
FTSE 100 has experienced an extremely big movement in last day. It may continue the trend, but this…
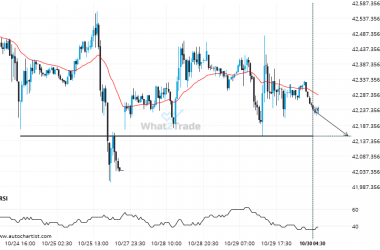
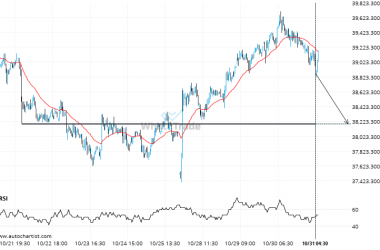
Will DOW 30 break through the support level it tested before?
DOW 30 is moving towards a key support level at 42151.3281. This is a previously tested level for…
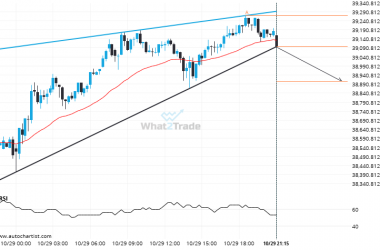
Nikkei 225 – breach of a trending support line that has been tested at least twice before.
Nikkei 225 has broken through a support line. It has touched this line at least twice in the…
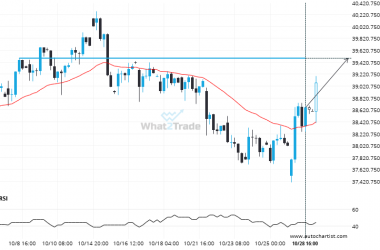
Supports and resistances are primary concepts of technical analysis. Nikkei 225 is heading for an important price of 39491.0000 – read about what this could mean for the future.
Nikkei 225 is moving towards a resistance line. Because we have seen it retrace from this level in…
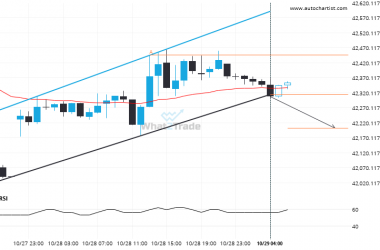
Interesting opportunity on DOW 30 after breaking 42315.06999999999
Flag pattern identified on DOW 30 has broken through a support level with the price momentum continuing to…
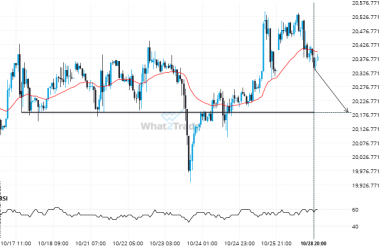
After testing 20185.9453 numerous times, NAS 100 is once again approaching this price point. Can we expect a bearish trend to follow?
A strong support level has been identified at 20185.9453 on the 1 hour NAS 100 chart. NAS 100…
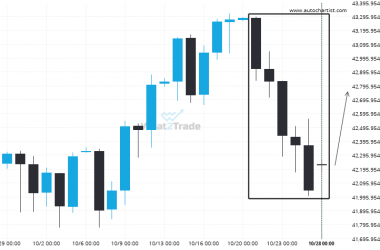
Is the DOW 30 poised for a turn-around after 6 consecutive bearish Daily candles?
DOW 30 has moved lower after 6 consecutive daily candles from 43285.1200 to 42222.0300 in the last 8…