Browsing Category
Indices mondiaux
6573 messages
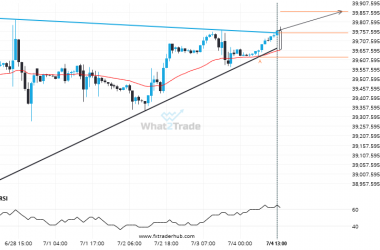
US30 has broken out from the Triangle pattern. Expect it to hit 39862.5617 soon.
US30 moved through the resistance line of a Triangle at 39747.95522388059 on the 1 hour chart. This line…
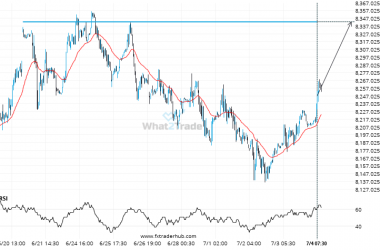
UK100 keeps moving closer towards 8342.5000. Will it finally breach this level?
UK100 is moving towards a key resistance level at 8342.5000. UK100 has previously tested this level 3 times…
Resistance line breached by AUS200. This price has been tested at least twice before.
You would be well advised to confirm the breakout that has just occurred – do you believe the…
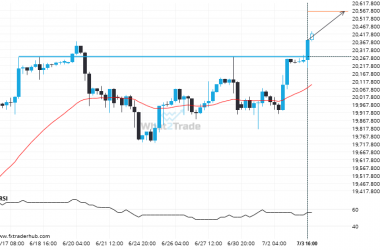
If you’re short NAS100 you should be aware that 20273.2500 has just been breached – a level tested 3 time in the past
The breakout of NAS100 through the 20273.2500 price line is a breach of an important psychological price that…
FRA40 seems to be on its way to resistance – a possible opportunity?
FRA40 is en route to a very important line that will be a definite deciding factor of what…
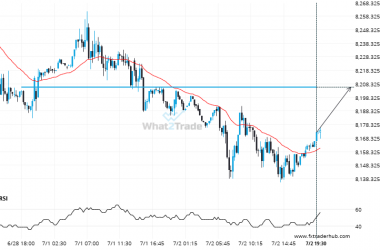
Will UK100 break through the resistance level it tested before?
UK100 is about to retest a key horizontal resistance level near 8206.0000. It has tested this level 3…
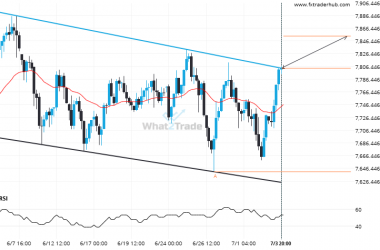
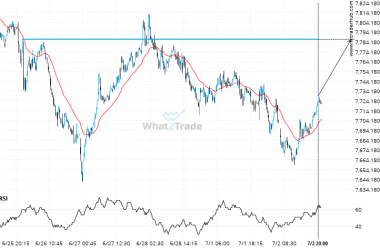
If AUS200 touches 7787.0000 it may be time to take action.
The movement of AUS200 towards 7787.0000 price line is yet another test of the line it reached numerous…
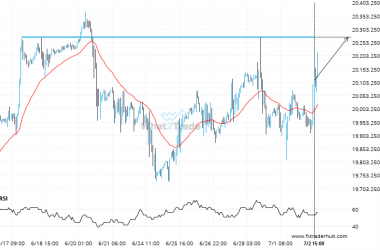
NAS100 – approaching a price line that has been previously tested numerous times in the past
NAS100 is moving towards a key resistance level at 20273.2500. NAS100 has previously tested this level 4 times…
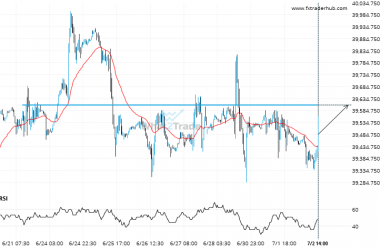
US30 – approaching a price line that has been previously tested numerous times in the past
A strong resistance level has been identified at 39607.0000 on the 30 Minutes US30 chart. US30 is likely…
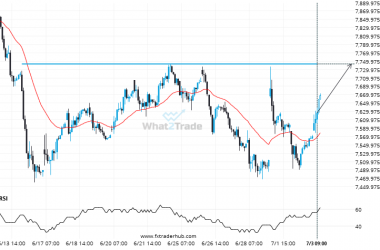
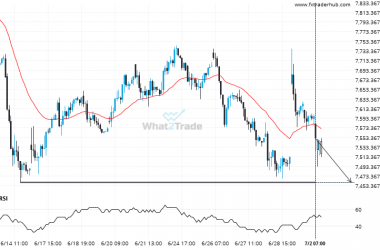
Important price line being approached by FRA40. This price has been tested numerous times before.
FRA40 is moving towards a key support level at 7460.0000. FRA40 has previously tested this level 3 times…

