
Browsing Category
Indices mondiaux
6961 messages
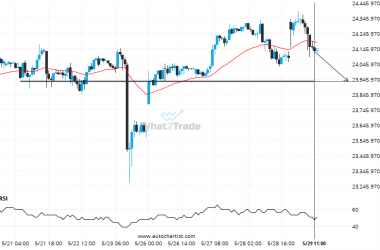
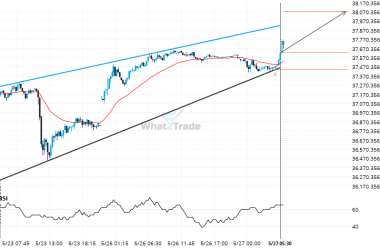
DAX 40 – approaching a price line that has been previously tested numerous times in the past
DAX 40 is moving towards a key support level at 23930.6992. DAX 40 has previously tested this level…
A Channel Up has formed, FTSE 100 is approaching support. Can we expect a breakout and the start of a new trend or a reversal?
FTSE 100 was identified at around 8777.07 having recently rebounded of the support on the 4 hour data…
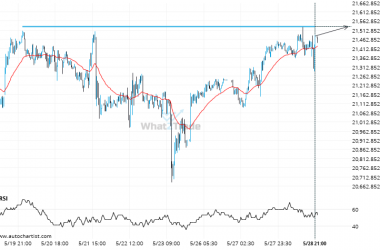
If NAS 100 touches 21531.2891 it may be time to take action.
NAS 100 is moving towards a resistance line. Because we have seen it retrace from this level in…
US 500 is signaling a possible trend reversal on the intraday charts with price not breaching support.
Emerging Rising Wedge detected on US 500 – the pattern is an emerging one and has not yet…
Is the extremely large movement on FTSE 100 a sign of things to come?
FTSE 100 rose sharply for 51 days – which is an excessively big movement for this instrument; exceeding…
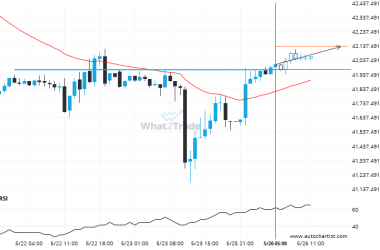
If you’re short DOW 30 you should be aware that 42145.2188 has just been breached – a level tested 3 time in the past
DOW 30 has broken through 42145.2188 which it has tested numerous times in the past. We have seen…
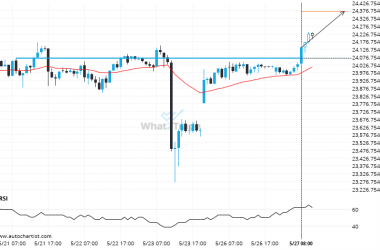
It’s time to make a decision on DAX 40 – its recent breach of 24067.5996 could be a sign of a new trend to follow.
The price of DAX 40 in heading in the direction of 24371.5996. Despite the recent breakout through 24067.5996…
Nikkei 225 is quickly approaching the resistance line of a Rising Wedge. We expect either a breakout through this line or a rebound.
Emerging Rising Wedge detected on Nikkei 225 – the pattern is an emerging one and has not yet…
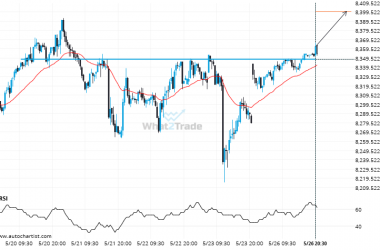
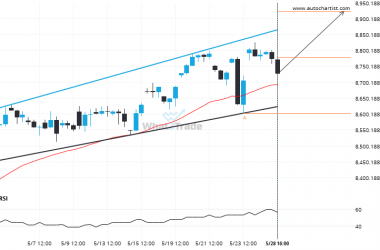
After trying numerous times in the past, ASX 200 finally breaks 8348.2002!
The price of ASX 200 in heading in the direction of 8400.2598. Despite the recent breakout through 8348.2002…
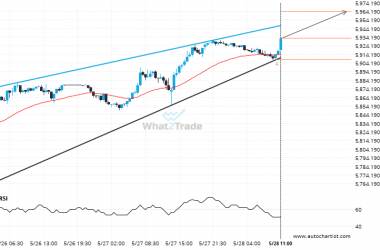
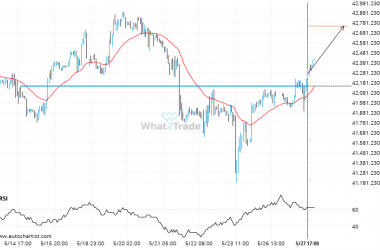
After testing 41969.6914 numerous times, DOW 30 has finally broken through. Can we expect a bullish trend to follow?
DOW 30 has breached the resistance line at 41969.6914. It may continue the bullish trend towards 42130.8828, or,…