
Browsing Category
Futures
10882 messages
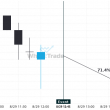
Gold Spot is signaling a possible trend reversal on the intraday charts with price not breaching support.
Gold Spot is moving towards a resistance line. Because we have seen it retrace from this line before,…
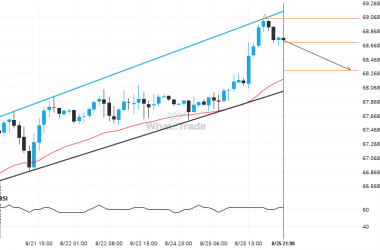
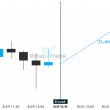
Brent Crude formed a Channel Up on the 1 hour chart. Retest of support in sight.
Brent Crude is moving towards a support line which it has tested numerous times in the past. We…
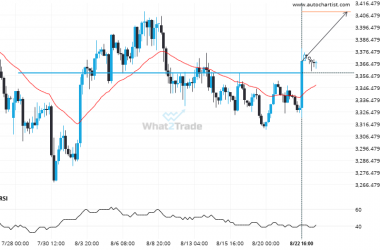
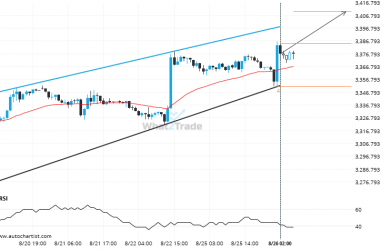
Big movement possible on Gold Spot after a breach of 3358.4751
Gold Spot has breached the resistance line at 3358.4751. It may continue the bullish trend towards 3408.8755, or,…
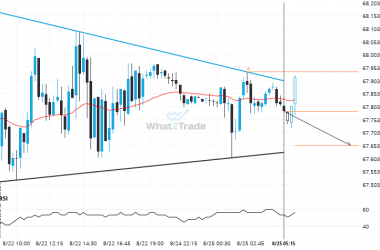
Brent Crude formed a Triangle on the 15 Minutes chart. Retest of support in sight.
Emerging Triangle detected on Brent Crude – the pattern is an emerging one and has not yet broken…
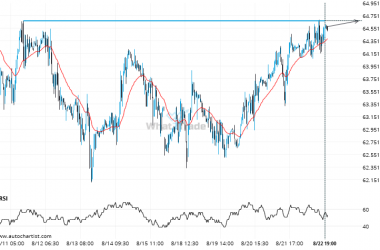
If US Oil touches 64.6650 it may be time to take action.
US Oil is moving towards a resistance line. Because we have seen it retrace from this level in…
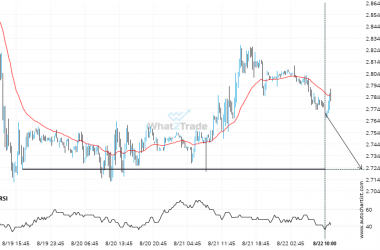
Supports and resistances are primary concepts of technical analysis. Natural Gas is heading for an important price of 2.7230 – read about what this could mean for the future.
Natural Gas is moving towards a key support level at 2.7230. This is a previously tested level for…
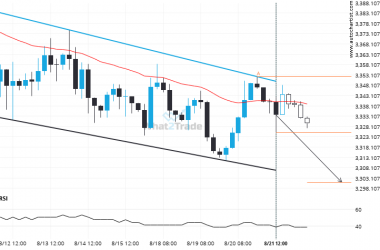
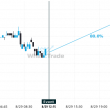
Gold Spot formed a Channel Down on the 4 hour chart. Retest of support in sight.
Gold Spot is moving towards a support line which it has tested numerous times in the past. We…
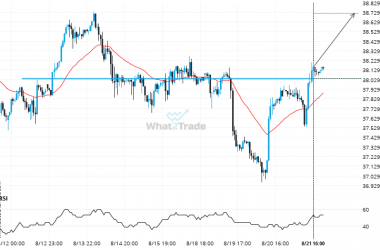
Breach of 38.0392 could mean a start of a bullish trend on Silver Spot
The price of Silver Spot in heading in the direction of 38.7158. Despite the recent breakout through 38.0392…
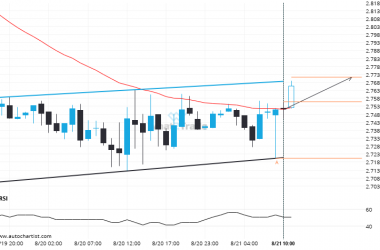
A Channel Up has formed, Natural Gas is approaching support. Can we expect a breakout and the start of a new trend or a reversal?
Natural Gas was identified at around 2.756 having recently rebounded of the support on the 1 hour data…
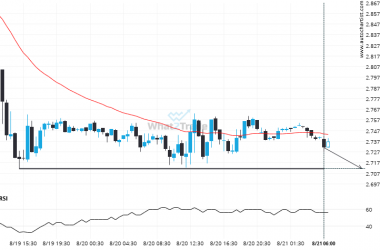
If Natural Gas touches 2.7115 it may be time to take action.
The price of Natural Gas in heading back to the support area. It is possible that it will…