
Browsing Category
Forex
6902 messages
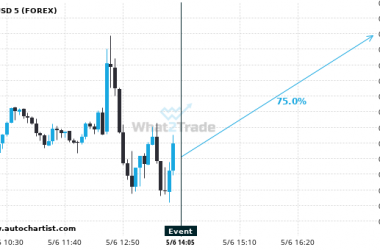
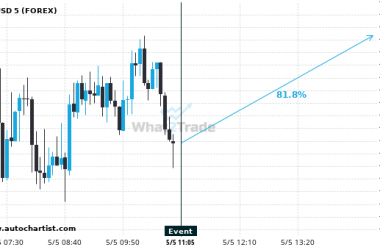
NZDUSD may be ready to trend upwards today with a 75% chance.
Based on the last 12 Ivey PMI s.a events in Canada, NZDUSD may trend upwards later today. Based…
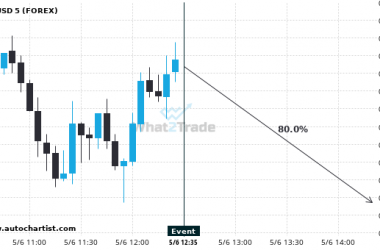
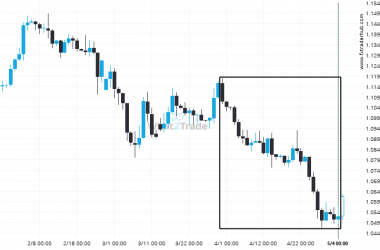
AUDUSD could trend downwards for the next 2 hours.
AUDUSD may trend downwards for the next 2 hours. Based on these past United States Non Farm Payrolls…
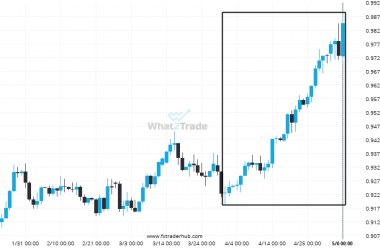
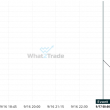
Huge bullish move on USD/CHF
USD/CHF has moved higher by 6.72% from 0.923 to 0.985 in the last 37 days.
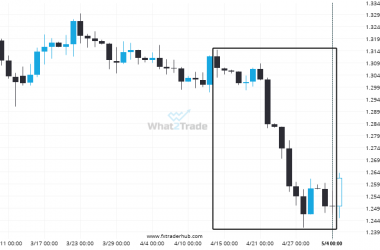
What’s going on with GBP/USD?
Those of you that are trend followers are probably eagerly watching GBP/USD to see if its latest 4.38%…
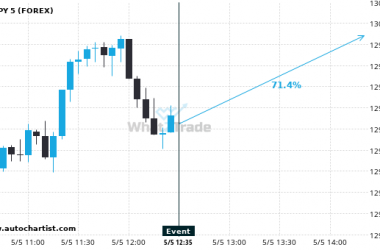
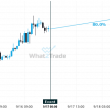
We could expect USDJPY to trend upwards right now.
Based on the last 12 Continuing Jobless Claims events in United States, we may expect USDJPY to trend…
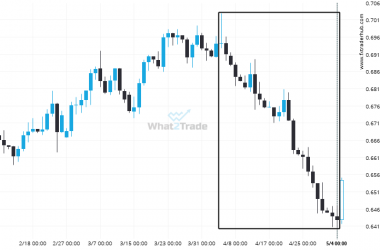
NZD/USD experienced an exceptionally large movement
No matter your trading style, keep an eye on NZD/USD after an exceptional 7.41% move. The movement has…
We may be expecting a $1,360 movement on EURUSD within 4 hours following the event release at 05 May 11:00.
Based on the last 12 BoE Interest Rate Decision events in United Kingdom, a $1,360 movement could occur…
What’s going on with EUR/USD?
Those of you that are trend followers are probably eagerly watching EUR/USD to see if its latest 4.94%…
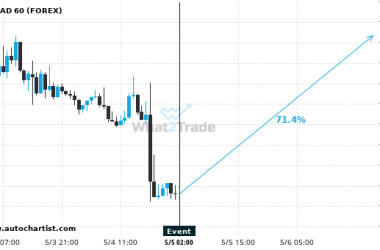
There is a 71.43% chance of USDCAD trending upwards
Based on past Australia Balance of Trade news events there is a 71.43% chance of USDCAD trending upwards.…
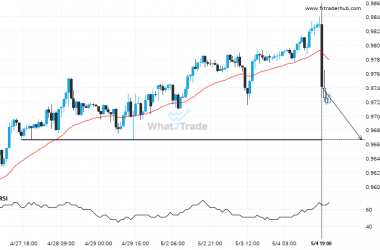
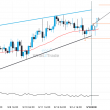
Either a rebound or a breakout imminent on USD/CHF
USD/CHF is heading towards a line of 0.9671. If this movement continues, the price of USD/CHF could test…