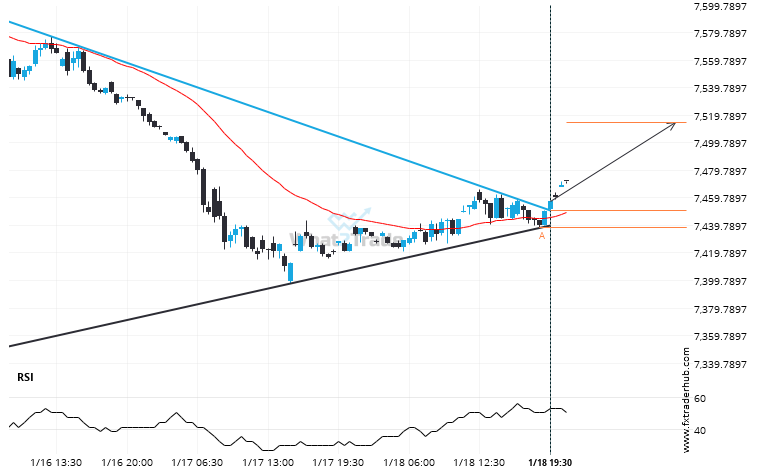
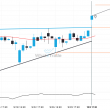
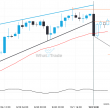
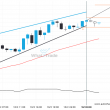
UK100 has broken through a resistance line of a Triangle chart pattern. If this breakout holds true, we may see the price of UK100 testing 7514.7451 within the next 13 hours. But don’t be so quick to trade, it has tested this line in the past, so you should confirm the breakout before taking any action.
Related Posts
Nikkei 225 is signaling a possible trend reversal on the intraday charts with price not breaching support.
Nikkei 225 was identified at around 43994.0 having recently rebounded of the support on the 4 hour data…
FTSE 100 is quickly approaching a very important level it has previously tested numerous times in the past
FTSE 100 is approaching a support line at 9120.0000. If it hits the support line, it may break…
NAS 100 – approaching a resistance line that has been previously tested at least twice in the past
Emerging Rising Wedge detected on NAS 100 – the pattern is an emerging one and has not yet…