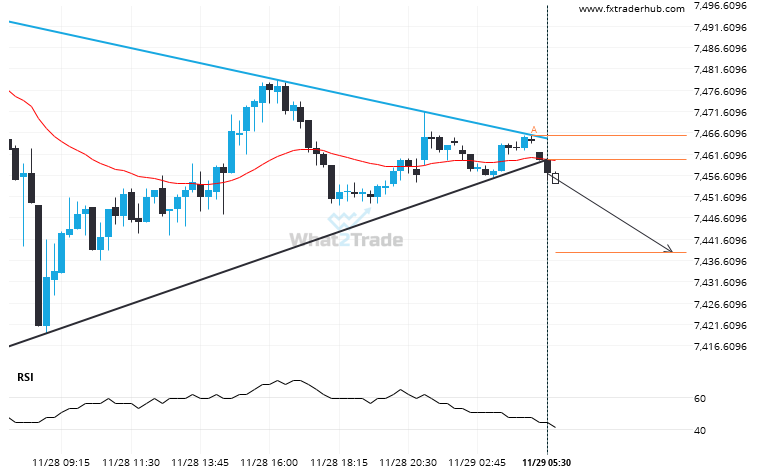
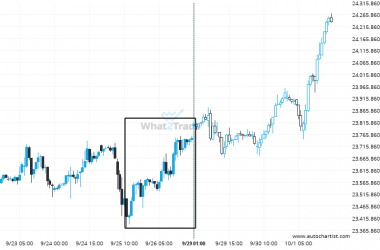
UK100 moved through the support line of a Triangle at 7460.405172413793 on the 15 Minutes chart. This line has been tested a number of times in the past and this breakout could mean an upcoming change from the current trend. It may continue in its current direction toward 7438.3781.
Related Posts
Breach of support could mean a start of a bearish trend on FTSE 100
You would be well advised to confirm the breakout that has just occurred – do you believe the…
US 500 keeps moving closer towards 5896.3398. Will it finally breach this level?
US 500 is moving towards a support line. Because we have seen it retrace from this level in…
US 500 – approaching a resistance line that has been previously tested at least twice in the past
US 500 is moving towards a resistance line which it has tested numerous times in the past. We…