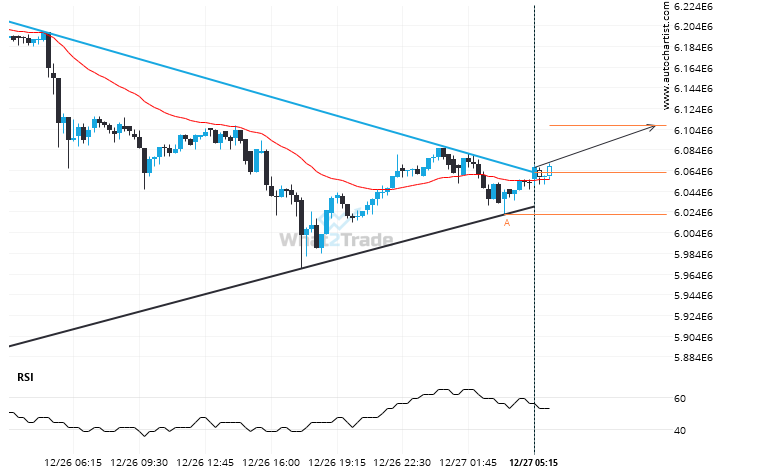
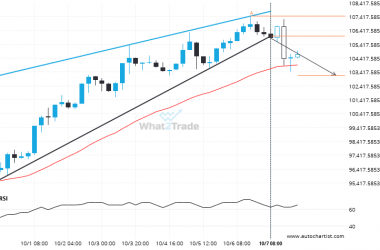
BTCJPY moved through the resistance line of a Triangle at 6062164.9008433735 on the 15 Minutes chart. This line has been tested a number of times in the past and this breakout could mean an upcoming change from the current trend. It may continue in its current direction toward 6107387.2859.
Related Posts
BTCEUR heading towards a price it has tested 5 times in the recent past.
BTCEUR is moving towards a resistance line. Because we have seen it retrace from this level in the…
A possible move on BCHUSD as it heads towards support
Emerging Falling Wedge pattern in its final wave was identified on the BCHUSD 1 hour chart. After a…
Extreme movement experienced on ADAUSD. Check this chart to see what to do next
ADAUSD dropped sharply for 19 days – which is an excessively big movement for this instrument; exceeding the…