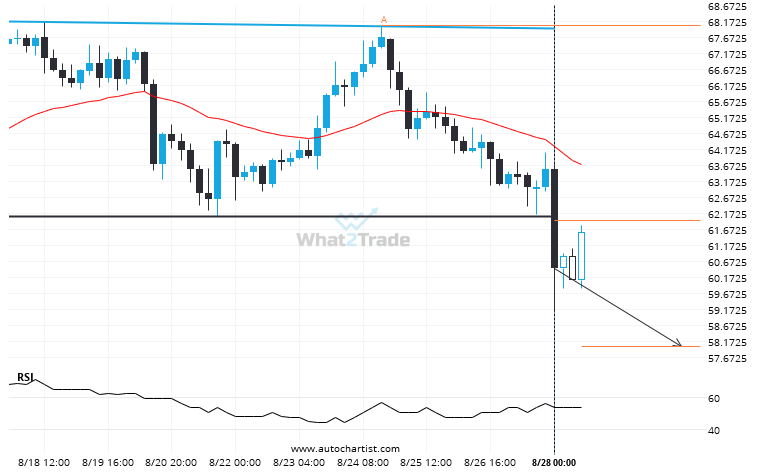
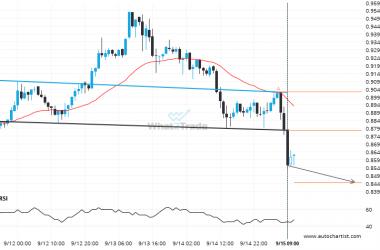
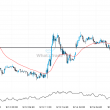
LTCUSD moved through the support line of a Double Top at 61.92999999999999 on the 4 hour chart. This line has been tested a number of times in the past and this breakout could mean an upcoming change from the current trend. It may continue in its current direction toward 57.9960.
Related Posts
After testing the support line numerous times, LTCUSD is once again approaching this line. Can we expect a bearish trend to follow?
LTCUSD is heading towards the support line of a Channel Down and could reach this point within the…
BTCEUR is currently testing a level of 91634.0703. Will the breakout continue or will things reverse?
BTCEUR has broken through a line of 91634.0703. If this breakout holds true, we could see the price…
LTCAUD is signaling a possible trend reversal on the intraday charts with price not breaching support.
LTCAUD is heading towards the resistance line of a Channel Down and could reach this point within the…