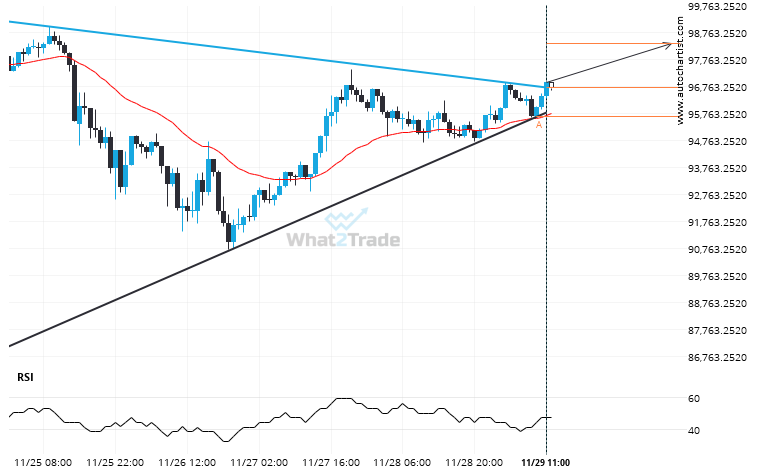
BTCUSD has broken through the resistance line of a Triangle technical chart pattern. Because we have seen it retrace from this line in the past, one should wait for confirmation of the breakout before taking any action. It has touched this line twice in the last 5 days and suggests a possible target level to be around 98353.3855 within the next 2 days.
Related Posts
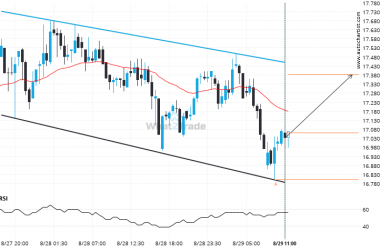
A Channel Down has formed, DASHGBP is approaching support. Can we expect a breakout and the start of a new trend or a reversal?
DASHGBP is trapped in a Channel Down formation, implying that a breakout is Imminent. This is a great…
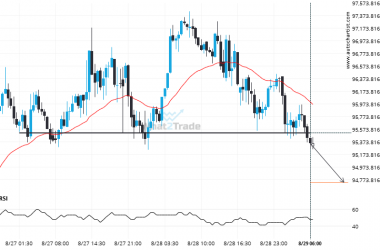
After trying numerous times in the past, BTCEUR finally breaks 95512.3828!
A strong support level has been breached at 95512.3828 on the 30 Minutes BTCEUR chart. Technical Analysis theory…
Interesting opportunity on LTCEUR after breaking 96.78823529411765
The last 5 30 Minutes candles on LTCEUR formed a Triangle pattern and broken out through the pattern…

