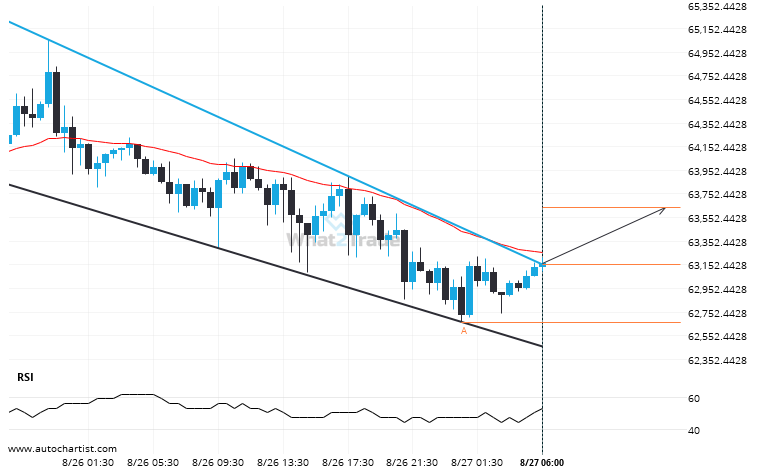
BTCUSD moved through the resistance line of a Channel Down at 63155.278648648644 on the 30 Minutes chart. This line has been tested a number of times in the past and this breakout could mean an upcoming change from the current trend. It may continue in its current direction toward 63642.2559.
Related Posts
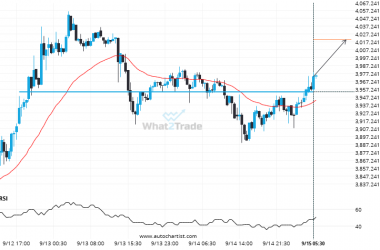
It’s time to make a decision on ETHEUR – its recent breach of 3953.8899 could be a sign of a new trend to follow.
ETHEUR has breached the resistance line at 3953.8899. It may continue the bullish trend towards 4020.4871, or, it…
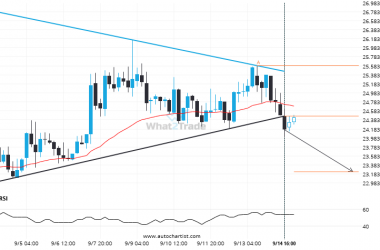
A possible move by DASHUSD towards 23.2361
DASHUSD has broken through a support line of a Triangle chart pattern. If this breakout holds true, we…
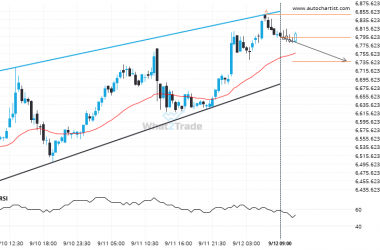
Because ETHAUD formed a Rising Wedge pattern, we expect it to touch the support line. If it breaks through support it may move much lower
Emerging Rising Wedge detected on ETHAUD – the pattern is an emerging one and has not yet broken…


