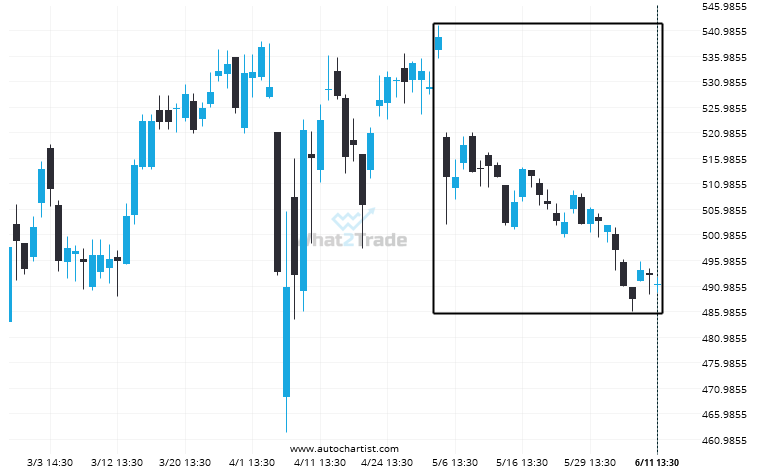
BRK.B dropped sharply for 40 days – which is an excessively big movement for this instrument; exceeding the 98% of past price moves. Even if this move is a sign of a new trend in BRK.B there is a chance that we will witness a correction, no matter how brief.
Related Posts
Rare bullish streak on the NKE 4 hour chart.
NKE posted 9 consecutive candles over the last 5 day — an unusually large movement.
After testing 155.5100 numerous times, CVX has finally broken through. Can we expect a bullish trend to follow?
The price of CVX in heading in the direction of 159.3810. Despite the recent breakout through 155.5100 it…
Important support line being approached by AMD. This price has been tested numerous time in the last 32 days
Emerging Channel Up pattern in its final wave was identified on the AMD 4 hour chart. After a…