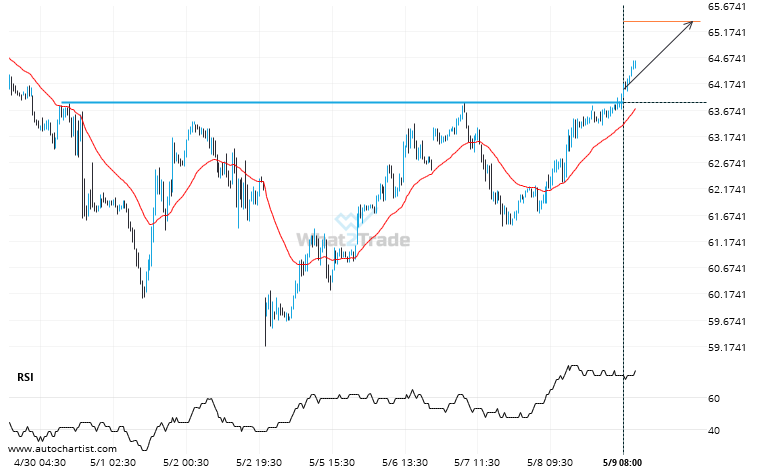
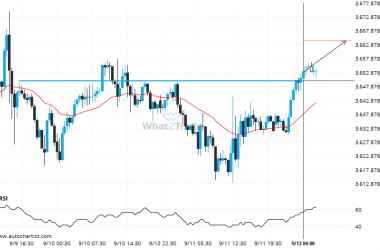
A strong resistance level has been breached at 63.8090 on the 30 Minutes Brent Crude chart. Technical Analysis theory forecasts a movement to 65.3643 in the next day.
Related Posts
After experiencing 7 consecutive daily bullish candles in the space of 8 days, nobody knows where Silver Spot is headed.
Due to the rate of consecutive bullish candles on Silver Spot Daily chart we could be in for…
Gold Spot is approaching 3381.6589. We expect either a breakout through this line, or a rebound.
Gold Spot is moving towards a line of 3381.6589 which it has tested numerous times in the past.…
After testing support twice in the past, Gold Spot has finally broken through. Can we expect a bearish trend to follow?
The breakout of Gold Spot through the support line of a Triangle could be a sign of the…