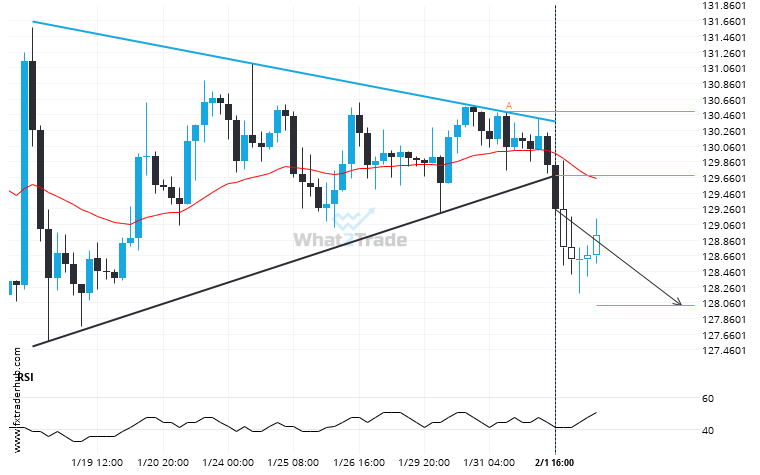
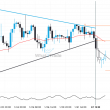
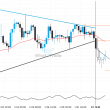
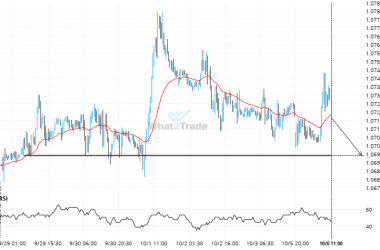
USD/JPY has broken through a support line of a Triangle chart pattern. If this breakout holds true, we may see the price of USD/JPY testing 128.0262 within the next 3 days. But don’t be so quick to trade, it has tested this line in the past, so you should confirm the breakout before taking any action.
Related Posts
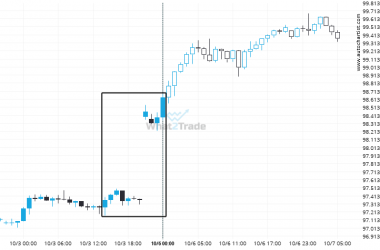
AUDJPY experienced a 1.31% bullish move in just 3 days. The magnitude speaks for itself.
AUDJPY reached 98.6335 after a 1.31% move spanning 3 days.
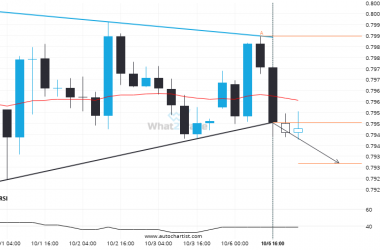
There is a possibility of a big movement on USDCHF after a breach of the support
USDCHF has broken through a support line. It has touched this line at least twice in the last…
GBPCHF likely to test 1.0694 in the near future. Where to next?
GBPCHF is heading towards 1.0694 and could reach this point within the next 2 days. It has tested…

