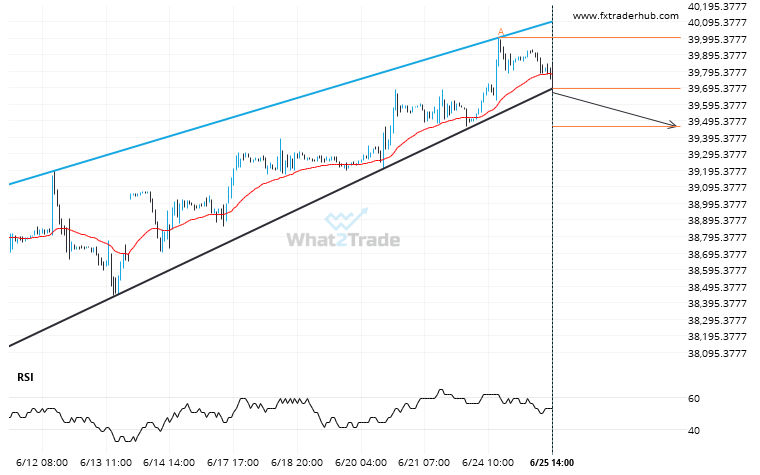
US30 moved through the support line of a Rising Wedge at 39688.916666666664 on the 1 hour chart. This line has been tested a number of times in the past and this breakout could mean an upcoming change from the current trend. It may continue in its current direction toward 39463.1146.
Related Posts
US 500 has broken through resistance of a Triangle. It has touched this line at least twice in the last 6 days.
US 500 has broken through a resistance line of a Triangle chart pattern. If this breakout holds true,…
DAX 40 – approaching a price line that has been previously tested numerous times in the past
DAX 40 is heading towards 23613.5000 and could reach this point within the next 20 hours. It has…
FTSE 100 is approaching a resistance line of a Rising Wedge. It has touched this line numerous times in the last 9 days.
Emerging Rising Wedge pattern in its final wave was identified on the FTSE 100 1 hour chart. After…