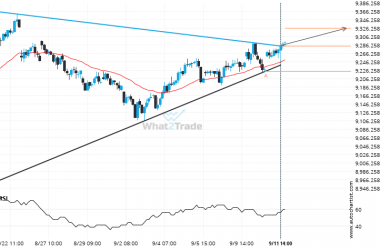
SPX500 has broken through a support line of a Descending Triangle chart pattern. If this breakout holds true, we expect the price of SPX500 to test 3136.0145 within the next 12 hours. But don’t be so quick to trade, it has tested this line in the past, so you should probably confirm the breakout before placing any trades.
Related Posts
NAS 100 is signaling a possible trend reversal on the intraday charts with price not breaching support.
NAS 100 is heading towards the resistance line of a Rising Wedge. If this movement continues, the price…
If DAX 40 touches 23544.0000 it may be time to take action.
DAX 40 is en route to a very important line that will be a definite deciding factor of…
FTSE 100 breakout from a Triangle trade setup. Will it continue this trend to hit the target price?
This trade setup on FTSE 100 is formed by a period of consolidation; a period in which the…


