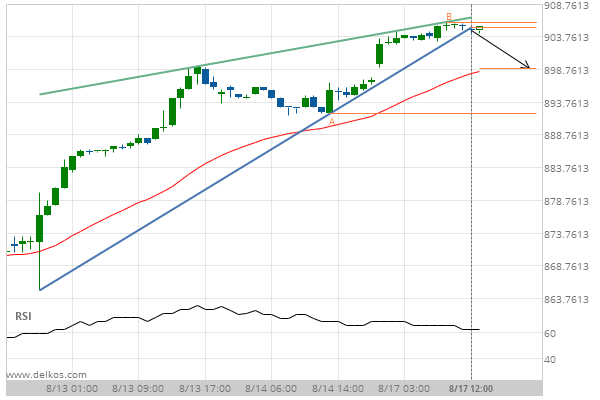
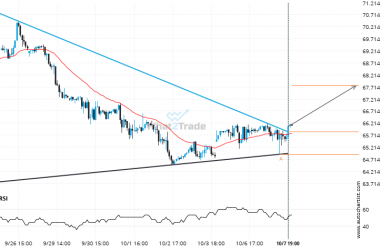
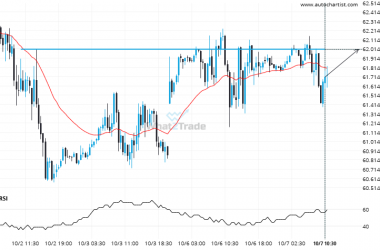
Soybeans SEPTEMBER 2020 has broken through a support line of a Rising Wedge chart pattern. If this breakout holds true, we expect the price of Soybeans SEPTEMBER 2020 to test 898.8734 within the next 16 hours. But don’t be so quick to trade, it has tested this line in the past, so you should probably confirm the breakout before placing any trades.
Related Posts
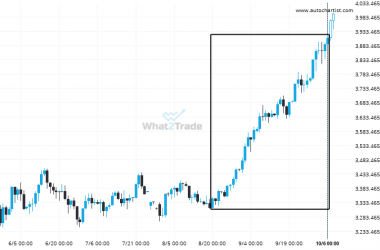
Gold Spot experienced a very large 48 days bullish move to 3909.648.
Gold Spot reached 3909.648 after a 16.81% move spanning 48 days.
Brent Crude through 65.85670422535212. Is this a confirming a breakout? Will it continue its path in the current trend toward 67.7624?
Triangle pattern identified on Brent Crude has broken through a resistance level with the price momentum continuing to…
Will US Oil break through the resistance level it tested before?
US Oil is moving towards a key resistance level at 62.0110. This is a previously tested level for…


