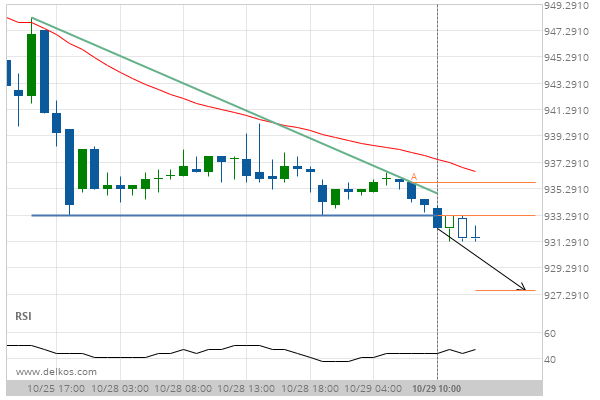
Soybeans JANUARY 2020 has broken through a support line of a Descending Triangle chart pattern. If this breakout holds true, we expect the price of Soybeans JANUARY 2020 to test 927.5808 within the next 7 hours. But don’t be so quick to trade, it has tested this line in the past, so you should probably confirm the breakout before placing any trades.
Related Posts
US Oil is currently testing a level of 62.2340. Will the breakout continue or will things reverse?
US Oil has broken through 62.2340 which it has tested numerous times in the past. We have seen…
A Rising Wedge has formed, Natural Gas is approaching support. Can we expect a breakout and the start of a new trend or a reversal?
Natural Gas was identified at around 3.1395 having recently rebounded of the support on the 30 Minutes data…
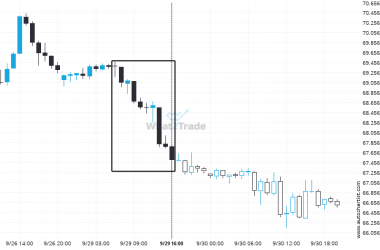
An unexpected large move occurred on Brent Crude 1 hour chart. The shift stands out in recent activity.
Brent Crude just posted a 2.7% move over the past 10 hours – a move that won’t go…

