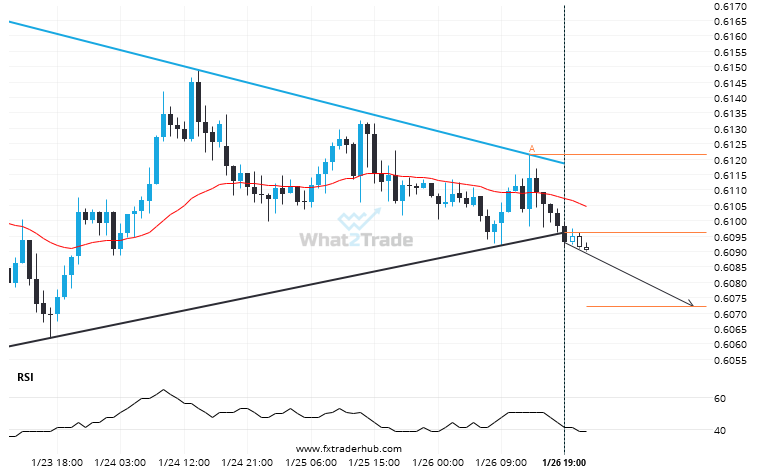
NZD/USD moved through the support line of a Triangle at 0.60963328125 on the 1 hour chart. This line has been tested a number of times in the past and this breakout could mean an upcoming change from the current trend. It may continue in its current direction toward 0.6072.
Related Posts
EURJPY – Large moves like this tend to draw attention.
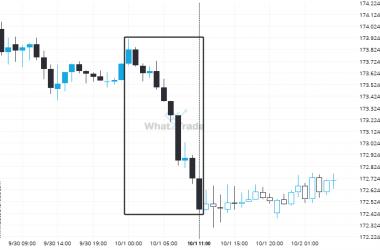
EURJPY reached 172.4555 after a 0.79% move spanning 11 hours.
EURAUD is quickly approaching the resistance line of a Channel Down. We expect either a breakout through this line or a rebound.
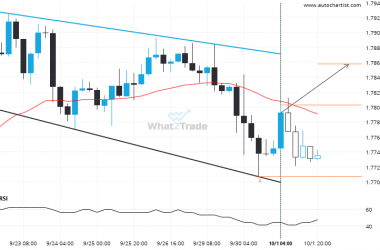
EURAUD was identified at around 1.780935 having recently rebounded of the support on the 4 hour data interval.…
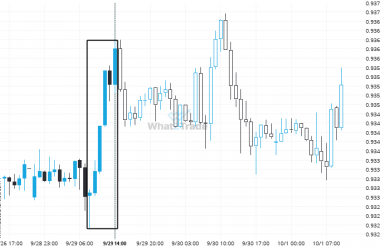
EURCHF reached 0.936355 after a 0.33% move spanning 6 hours.
EURCHF recorded an exceptional 0.33% move over the last 6 hours. Whether you follow trends or look for…

