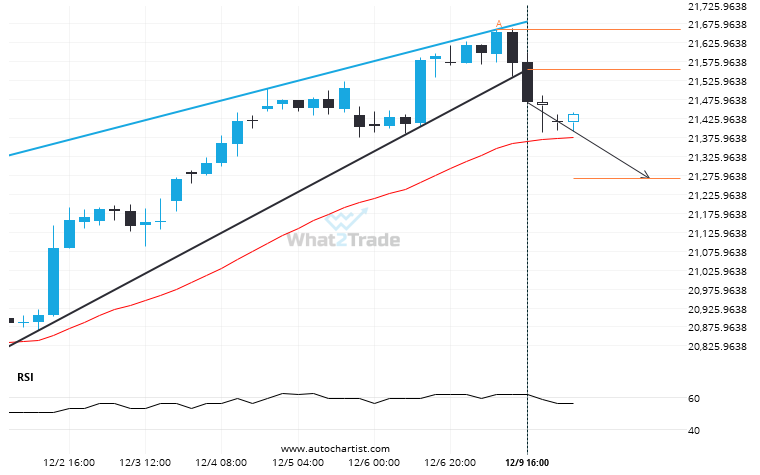
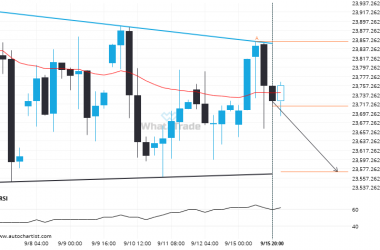
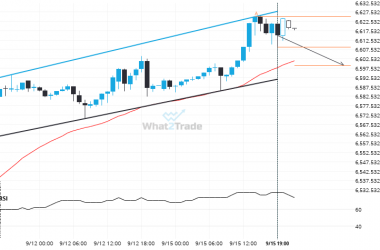
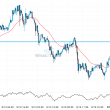
The last 14 4 hour candles on NAS 100 formed a Rising Wedge pattern and broken out through the pattern lines, indicating a possible bearish movement towards the price level of 21267.5038.
Related Posts
A Descending Triangle has formed, Nikkei 225 is approaching resistance. Can we expect a breakout and the start of a new trend or a reversal?
Nikkei 225 is trapped in a Descending Triangle formation, implying that a breakout is Imminent. This is a…
CAC 40 likely to test 8088.0000 in the near future. Where to next?
The price of CAC 40 in heading back to the support area. It is possible that it will…
Could a large bearish move on ASX 200 be a sign of things to come?
Those of you that are trend followers are probably eagerly watching ASX 200 to see if its latest…