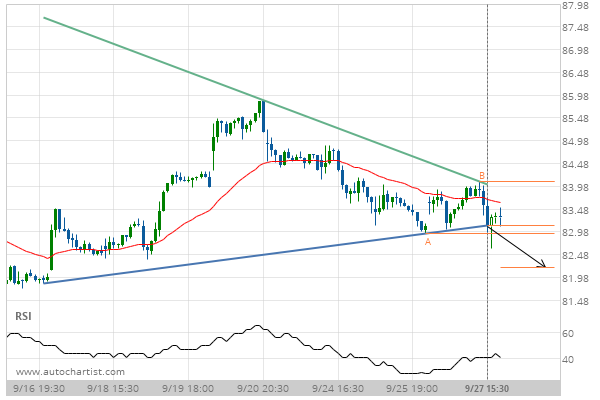
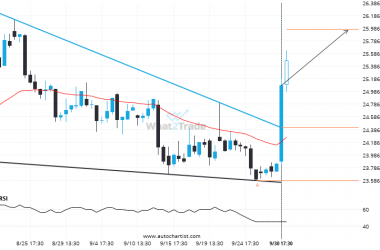
Merck & Co. Inc. has broken through a support line of a Triangle chart pattern. If this breakout holds true, we expect the price of Merck & Co. Inc. to test 82.21 within the next 16 hours. But don’t be so quick to trade, it has tested this line in the past, so you should probably confirm the breakout before placing any trades.
Related Posts
NFLX – approaching a support line that has been previously tested at least twice in the past
A Falling Wedge pattern was identified on NFLX at 1178.335, creating an expectation that it may move to…
After testing 743.9550 numerous times, META has finally broken through. Can we expect a bearish trend to follow?
META has breached the support line at 743.9550. It may continue the bearish trend towards 708.9245, or, it…
Interesting opportunity on PFE after breaking 24.416999999999994
This trade setup on PFE is formed by a period of consolidation; a period in which the price…

